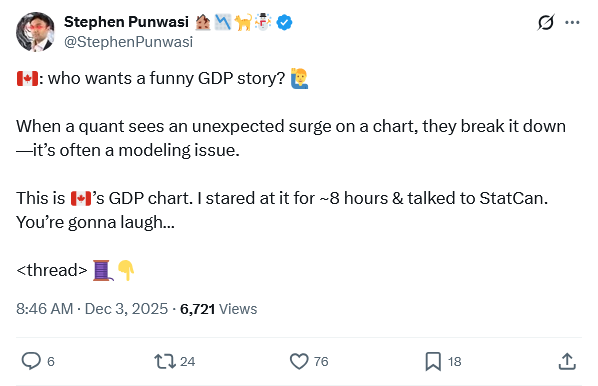
On the social media site formerly known as Twitter, Stephen Punwasi put together an interesting thread on the latest “rosy scenario” GDP numbers the state media have been making such a big deal about:
2/ What do we see? Imports contributed 0.7 points out of 0.6 points of Q3 GDP growth. The rest of the economy was a net drag.
Imports contribute to GDP as a part of net exports: exports minus imports.
Smaller imports boost net exports. Imports made the biggest drop since 2022.
3/ What we’re seeing is a phenomenon called import compression: the balance was boosted by falling imports.
It’s a superficial improvement due accounting mechanics. The only growth is actually weakness.
We figured it out. But wait — how do they get import/export data? 😬
4/ Let’s start with imports. I recalled reading about the CBSA’s new customs & revenue management (CARM) platform.
Totally normal bedtime reading for weirdos, I know.
CARM delayed data to StatCan, who had to estimate on trend & revise. I can’t recall the issue being resolved.
4/ I contact StatCan. Delays have improved but recent data is heavily impacted.
They warn to expect larger than usual revisions to September — a third of Q3. 😅
It gets funnier: 🇺🇸’s gov shutdown means 🇨🇦 can’t get data for ~75% of its exports. Trend estimate again.
5/ so all GDP growth was imports, which fell faster than exports.
Imports & exports are estimates based on trend.
But wait — what exactly is a trend? It’s based on seasonal adjustments — smoothing predictable variation.
In 🇨🇦, that means suppressing summer & boosting winter.
6/ non-predictable variations to consumption like recession & trade wars can’t be filtered out.
The adjustment over/understates. e.g. 🇺🇸 Fed research shows this overstated recovery & lengthened the financial crisis. Ditto with COVID.
It can’t be fixed until years later.
7/ let’s put this together:
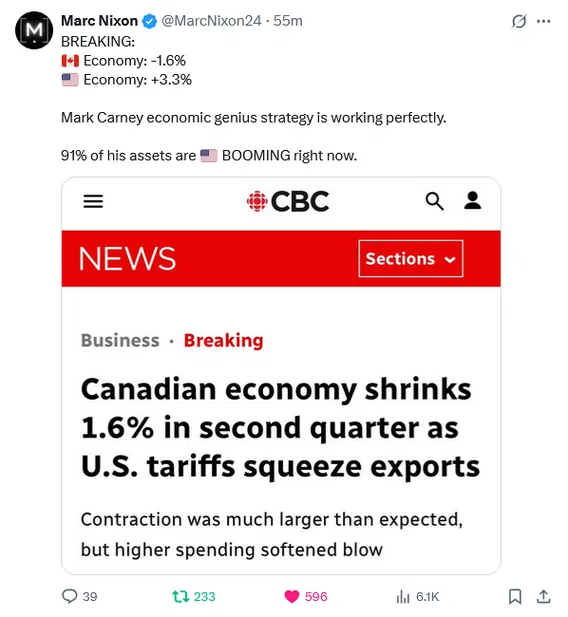
– 🇨🇦’s GDP grew exclusively due to the trade balance.
– import compression — a weakness that overstates growth
– trade had to be inferred via trend
– trend overstated by irregular shock
Yup.
8/ just to clarify — none of this is StatCan’s fault.
They’re tasked w/a deadline over the past year & 🇨🇦 decided to overhaul its trade data during a trade war.
They told me Dec 11th will be when revisions for imports come in & we’ll get an update on CARM.
9/ Bonus fun facts for the pros:
– by pushing it back to the 11th, this overstatement helps suppress yields for the GoC cash management program
– the 11th is after the last auction data is provided to dealers
Fascinating combo while 🇨🇦 is asset cycling for short-term optics.
10/ anyway, full write up, direct quotes from StatCan, & a fun bonus GDP fact for the kiddos.
Also, follow @BetterDwelling if you found this interesting.
We take research & insights reserved for deep-pocketed investors & give it away to normies w/plain english explanations.