
I hesitate to recommend academic books to anyone, but I’ll make an exception for James C. Scott’s Seeing Like a State. Subtitled “how certain schemes to improve the human condition have failed”, it’s the best long-form exposition I know of, that explains how process and outcome first deform, then negate each other.
[…]
In brief, Scott argues that the process of making a society “legible” to government officials obscures social reality, to the point where the government’s maps and charts and graphs take on a life of their own. It’s recursive, such that those well-intentioned schemes end up first measuring, then manipulating, the wrong thing in the wrong way, to the point that the social “problem” the process was supposed to address drops out entirely — all you have, at the end, is powerpoint girls critiquing spreadsheet boys because their spreadsheets don’t have enough animation, and vice versa.
Scott doesn’t use the Domesday Book as an example (IIRC from a graduate school class 20-odd years ago, anyway), but it’s one we’re probably all familiar with. The first thing William the Conqueror needed to know is: what, exactly, have I conquered? So he sent out the high-medieval version of spreadsheet boys to take a comprehensive survey of the kingdom. Turns out the Duke of Earl’s demense runs from this creek to that rock. He has five underlings, and their domains run from etc.
The point of all this, of course, was so that Billy C. could call the Duke of Earl on the carpet, point to the spreadsheet, and say “You owe me a cow, three chickens, and two months in the saddle as back taxes.” It worked great, except when — as, it seems, is inevitable — the high-medieval equivalent of the spreadsheet boys did the high-medieval version of “ctrl-c”; just copying and pasting the information over. Eventually the tax situation got way out of whack, as it did for most every pre-modern government running a similar system — one of the reasons declining Chinese dynasties had such fiscal problems, for instance, is that the tax surveys only got updated every two centuries or so, such that a major provincial lord was still only paying 20 silver pieces in taxes, when he should’ve been paying 20,000 (and his peasants were all paying 20 when all they could afford was 2).
In other words: unless the spreadsheet boys periodically go out and check that the numbers on their spreadsheets actually correspond in some systematic, more-or-less representative way to some underlying social reality, government policy is being set by make-believe.
Severian, “The Finger is Not the Moon”, Rotten Chestnuts, 2021-09-14.
December 1, 2024
QotD: Recording and codifying the land that William conquered
November 27, 2024
Trump’s plan to dismiss transgender troops will apparently “gut” the US military
As if the US military services hadn’t suffered enough from their own government, it’s now being widely asserted in the media that Trump’s declared plan to get rid of all current transgender service members will be a desperately hard blow to an already over-stressed military structure:
The news media is calmly warning that Donald Trump is planning to ban transgender servicemembers from the American military, which will absolutely gut the armed forces.
Sample claim, from Newsweek, quoting the leader of an LGBT advocacy nonprofit:
Abruptly discharging 15,000-plus service members, especially given that the military’s recruiting targets fell short by 41,000 recruits last year, adds administrative burdens to war fighting units.
There would be a significant financial cost, as well as a loss of experience and leadership that will take possibly 20 years and billions of dollars to replace.
We’ll practically have no military left! It would be like a whole infantry division suddenly just vanishing: 15,000-plus transgendered service members.
You’re going to see this number a lot in the weeks ahead. The New Republic, today: “Donald Trump’s plan to ban transgender people from the military would have a devastating effect: At least 15,000 members would be forced to leave.”
That number comes from a 2018 report by the now-defunct Palm Center, a pro-LGBT independent research institute in California, which reached this conclusion: “Transgender troops make up 0.7% (seven-tenths of one percent) of the military (Active Component and Selected Reserve)”. Their best guess about a total number: 14,707. The media is just rounding that number up to the next thousand.
The Palm Center … extrapolated a lot, let’s say, in good part by multiplying their guess about a percentage, derived from a grossly inadequate survey of a select number of active duty troops, times the total number of servicemembers. Page 4:
Assuming that the distribution of transgender men and women is roughly equivalent in the Active and Selected Reserve Components, it is possible to derive an estimate of the number of transgender troops in the Selected Reserve as follows. The number of transgender women is .0066 x 652,623 = 4,307 and the number of transgender men is .0091 x 156,080 = 1,420. The total number of transgender members of the Selected Reserve is 4,307 + 1,420 = 5,727. And, the total number of transgender troops is 8,980 (active) + 5,727 (reserve) = 14,707.
Assuming the distribution, it is possible to derive an estimate. That’s the basis of the 15,000 number that you’ll see in news stories. Remember that language.
Similarly, a 2016 RAND study offered these findings (among others), and note the remarkable thing that happens between the first and second paragraph:
It is difficult to estimate the number of transgender personnel in the military due to current policies and a lack of empirical data. Applying a range of prevalence estimates, combining data from multiple surveys, and adjusting for the male/female distribution in the military provided a midrange estimate of around 2,450 transgender personnel in the active component (out of a total number of approximately 1.3 million active-component service members) and 1,510 in the Selected Reserve.
Only a subset will seek gender transition–related treatment. Estimates derived from survey data and private health insurance claims data indicate that, each year, between 29 and 129 service members in the active component will seek transition-related care that could disrupt their ability to deploy.
So studies indicate that there are 3,960 transgendered servicemembers, and also that there are 14,707 transgendered servicemembers, and “between 29 and 129 service members in the active component” who will actively seek gender transition services in a typical year.
So it’s definitely somewhere between 29 and 15,000.
November 10, 2024
WW2 in Numbers
World War Two
Published 9 Nov 2024World War II wasn’t just the deadliest conflict in history — it was a war of unprecedented scale. From staggering casualty numbers to military production and economic costs, this episode breaks down the biggest statistics that defined the global conflict.
(more…)
November 2, 2024
QotD: UBI discourages low-income workers
Earlier this month, a cross-border team of North American economists published the results of a landmark study, probably the best and most careful yet done, of how low-income workers respond to an unconditional guaranteed income. Not so long ago this would have been a plus-sized news item in narcissistic Canada, for the lead author of the study is a rising economics star at the University of Toronto, Eva Vivalt. The economists, working through non-profit groups, recruited 3,000 people below a certain income cutoff in the suburbs of Dallas and Chicago. A thousand of these, chosen at random, were given a thousand dollars a month for three years. The rest were assigned to a control group that got just $50 a month, plus small extra amounts to encourage them to stay with the study and fill in questionnaires.
That randomization is an important source of credibility, and the study has several other impressive methodological bona fides. If you have an envelope to scribble on the back of, you can see that the payments alone were beyond the wildest dreams of most social science: most of the money was provided by the AI billionaire Sam Altman. But the study also had help from state governments, who agreed to forgo welfare clawbacks from the participants to make sure the observed effects weren’t obscured by local circumstances. Participant households were also screened carefully to make sure nobody in them was already receiving disability insurance. (Free money doesn’t discourage work among people who can’t work — or who absolutely won’t.) And the study combined questionnaire data with both smartphone tracking and state administrative records, yielding an unusually strong ability to answer difficult behavioural questions.
The big picture shows that the free cash — a “universal basic income” (UBI) for a small group of individuals — discouraged paying work, even though everybody in the study was starting out poor. Labour market participation among the recipients fell by two percentage points, even though the study period was limited to three years, and the earned incomes of those getting the cheques declined by $1,500 a year on average. There is no indication that the cash recipients used their augmented bargaining power to find better jobs, and no indication of “significant effects on investments in human capital”, i.e., training and education. The largest change in time use in the experiment group was — wait for it! — “time spent on leisure”.
Colby Cosh, “Universal basic income is a recipe for fiscal suicide (for so many reasons)”, National Post, 2024-07-30.
October 7, 2024
The demographic impact of modern cities
Lorenzo Warby touches on some of the social and demographic issues that David Friedman discussed the other day:
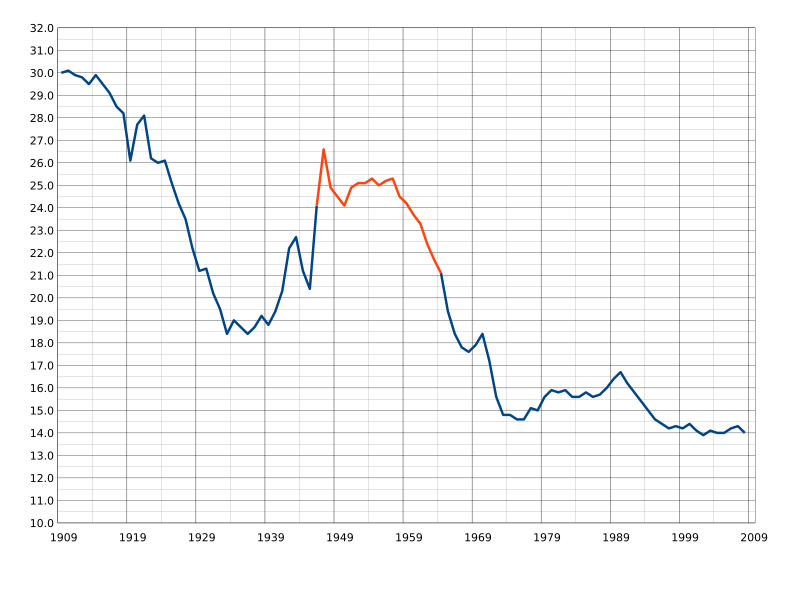
US Birth Rates from 1909-2008. The number of births per thousand people in the United States. The red segment is known as the Baby Boomer period. The drop in 1970 is due to excluding births to non-residents.
Graph by Saiarcot895 via Wikimedia Commons
Cities are demographic sinks. That is, cities have higher death rates than fertility rates.
For much of human history, cities have been unhealthy places to live. This is no longer true: cities have higher average life expectancies than rural areas. But they are still demographic sinks, for cities collapse fertility rates.
The problem is not that more women have no children, or only one child, making it to adulthood. Such women have always existed, though their share of the population has gone up across recent decades.
The key problem is the collapse in the demographic “tail” of large families. Cities are profoundly antipathetic to large families, and have always been so. This is particularly true of apartment cities — suburbs are somewhat more amenable to large families, though not enough to make up for the urbanisation effect.
While modern cities do not have slaves and household servants who were blocked from reproducing as ancient cities did, various aspects of modern technology have fertility-suppressing effects. Cars that presume a maximum of three children, for instance. An effect that is worsened by compulsory baby car-seats. Or ticketing and accommodation that presumes two children or less. There is also the deep problems of modern online dating. Plus the effects that endocrine disrupters and falling testosterone may be having.
These effects also extend to rural populations: falling fertility in rural populations is far more of a mystery than falling fertility in urban populations. How much declining metabolic health plays in all this is unclear. Indeed, futurist Samo Burja is correct, we do not really understand the “social technology” of human breeding.
Be that as it may, cities as demographic sinks is a continuation of patterns that go back to the first cities.
Matters at the margin
There are factors at the margin known to make a difference. Religious folk breed more than secular folk, though that is in part because rural people are more religious and city folk more secular.
Educating women reduces fertility. This is, in part, an urbanisation effect, as more education is available in cities. It is also an opportunity cost effect — there is more to do in cities, both paid and unpaid.
Education increases the general opportunity cost of motherhood, by expanding women’s opportunities. This also makes moving to cities more attractive. Women having more career opportunities reduces the relative attractiveness of men as marriage partners, reducing the marriage rate.
Strong cultural barriers against children outside marriage can reduce the fertility rate, by largely restricting motherhood to married women. This makes the fertility rate more dependant on the marriage rate.
Educating women makes children more expensive, as educated mothers have educated children. Part of the patterns that economist Gary Becker analysed.
September 21, 2024
Statistics Canada notes significant decline in life satisfaction and hope for the future
In one sense, we should be quite used to Statistics Canada giving us unwelcome economic news, given the state of the Canadian economy over the last decade. What seems less in character is that they’re connecting the dots between our obvious national financial decline and showing how directly it has impacted ordinary Canadians’ views about life in Canada and what they expect in the future:
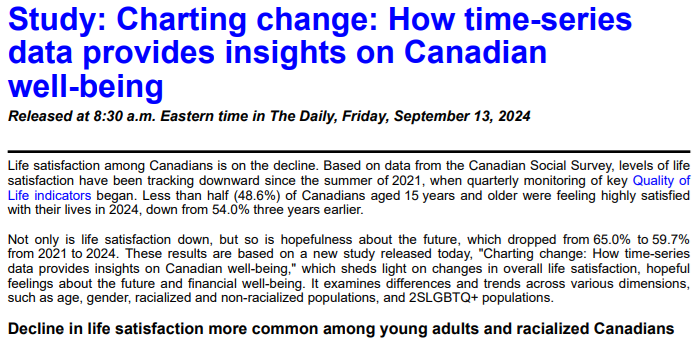
Life satisfaction among Canadians is on the decline. Based on data from the Canadian Social Survey, levels of life satisfaction have been tracking downward since the summer of 2021, when quarterly monitoring of key Quality of Life indicators began. Less than half (48.6%) of Canadians aged 15 years and older were feeling highly satisfied with their lives in 2024, down from 54.0% three years earlier.
Not only is life satisfaction down, but so is hopefulness about the future, which dropped from 65.0% to 59.7% from 2021 to 2024. These results are based on a new study released today, “Charting change: How time-series data provides insights on Canadian well-being”, which sheds light on changes in overall life satisfaction, hopeful feelings about the future and financial well-being. It examines differences and trends across various dimensions, such as age, gender, racialized and non-racialized populations, and 2SLGBTQ+ populations.
Decline in life satisfaction more common among young adults and racialized Canadians
Life satisfaction can be considered a pulse check on Canadians’ overall well-being. While this indicator of subjective well-being has been declining for the past few years, there is nonetheless substantive variation in life satisfaction across different demographic groups. Younger adults (aged 25 to 34) had notable declines in their life satisfaction in 2024, with their proportions declining an average of 3.9 percentage points per year since 2021. By 2024, fewer than 4 in 10 (36.9%) of these adults were highly satisfied with their lives.
Meanwhile, seniors (aged 65 and older) maintained their high level of satisfaction, with 61.5% being happy with their lives in 2024. This measure of subjective well-being has remained relatively stable among senior Canadians since 2021.
In addition, racialized Canadians, who are younger on average than non-racialized Canadians, saw greater drops in life satisfaction than their non-racialized counterparts. The proportion of racialized Canadians reporting high levels of life satisfaction fell from 52.7% in 2021 to 40.6% in 2024. This decline was more than five times higher than the decrease observed for non-racialized Canadians, who experienced a decline in life satisfaction of 0.8 percentage points per year from 2021 to 2024. In 2024, over half (51.5%) of non-racialized Canadians were happy with their lives.
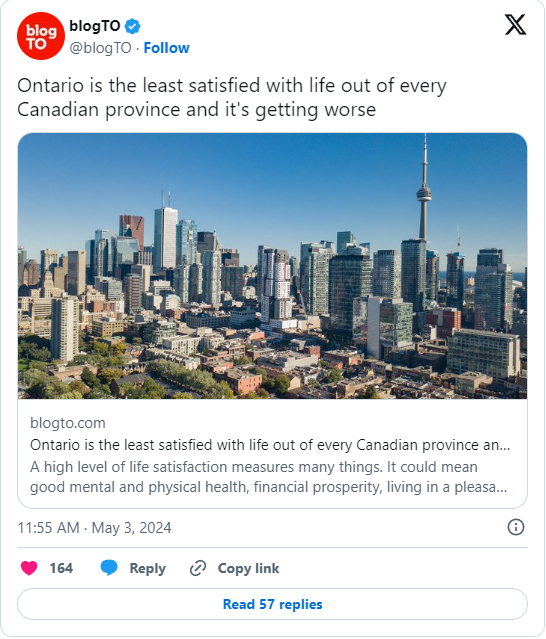
It really is a bad sign when the largest province in Confederation is also becoming the most disheartened by its economic prospects:
August 19, 2024
Bret Devereaux on Nathan Rosenstein’s Rome at War (2004)
Although Dr. Devereaux is taking a bit of time away from the more typical blogging topics he usually covers on A Collection of Unmitigated Pedantry, he still discusses books related to his area of specialty:

For this week’s book recommendation, I want to recommend N. Rosenstein, Rome at War: Farms, Families and Death in the Middle Republic (2004). This is something of a variation from my normal recommendations, so I want to lead with a necessary caveat: this book is not a light or easy read. It was written for specialists and expects the reader to do some work to fully understand its arguments. That said, it isn’t written in impenetrable “academese” – indeed, the ideas here are very concrete, dealing with food production, family formation, mortality and military service. But they’re also fairly technical and Rosenstein doesn’t always stop to recap what he has said and draw fully the conclusions he has reached and so a bit of that work is left to the reader.
That said, this is probably in the top ten or so books that have shaped me as a scholar and influenced my own thinking – as attentive readers can no doubt recall seeing this book show up a lot in my footnotes and citations. And much like another book I’ve recommended, Landers, The Field and the Forge: Population, Production and Power in the Pre-Industrial West (2003), this is the sort of book that moves you beyond the generalizations about ancient societies you might get in a more general treatment (“low productivity, high mortality, youth-shifted age profile, etc.”) down to the actual evidence and methods we have to estimate and understand that.
Fundamentally, Rome at War is an exercise in “modeling” – creating (fairly simple) statistical models to simulate things for which we do not have vast amounts of hard data, but for which we can more or less estimate. For instance, we do not have the complete financial records for a statistically significant sample of Roman small farmers; indeed, we do not have such for any Roman small farmers. So instead, Rosenstein begins with some evidence-informed estimates about typical family size and construction and combines them with some equally evidence-informed estimates about the productivity of ancient farms and their size and then “simulates” that household. That sort of approach informs the entire book.
Fundamentally, Rosenstein is seeking to examine the causes of a key Roman political event: the agrarian land-reform program of Tiberius Gracchus in 133, but the road he takes getting there is equally interesting. He begins by demonstrating that based on what we know the issue with the structure of agriculture in Roman Italy was not, strictly speaking “low productivity” so much as inefficient labor allocation (a note you will have seen me come back to a lot): farms too small for the families – as units of labor – which farmed them. That is a very interesting observation generally, but his point in reaching it is to show that this is why Roman can conscript these fellows so aggressively: this is mostly surplus labor so pulling it out of the countryside does not undermine these households (usually). But that pulls a major pillar – that heavy Roman conscription undermined small freeholders in Italy in the Second Century – out of the traditional reading of the land reforms.
Instead, Rosenstein then moves on to modeling Roman military mortality, arguing that, based on what we know, the real problem is that Rome spends the second century winning a lot. As a result, lots of young men who normally might have died in war – certainly in the massive wars of the third century (Pyrrhic and Punic) – survived their military service, but remained surplus to the labor needs of the countryside and thus a strain on their small households. These fellows then started to accumulate. Meanwhile, the nature of the Roman census (self-reported on the honor system) and late second century Roman military service (often unprofitable and dangerous in Spain, but not with the sort of massive armies of the previous centuries which might cause demographically significant losses) meant that more Romans might have been dodging the draft by under-reporting in the census. Which leads to his conclusion: when Tiberius Gracchus looks out, he sees both large numbers of landless Romans accumulating in Rome (and angry) and also falling census rolls for the Roman smallholder class and assumes that the Roman peasantry is being economically devastated by expanding slave estates and his solution is land reform. But what is actually happening is population growth combined with falling census registration, which in turn explains why the land reform program doesn’t produce nearly as much change as you’d expect, despite being more or less implemented.
Those conclusions remain both important and contested. What I think will be more valuable for most readers is instead the path Rosenstein takes to reach them, which walks through so much of the nuts-and-bolts of Roman life: marriage patterns, childbearing patterns, agricultural productivity, military service rates, mortality rates and so on. These are, invariably, estimates built on estimates of estimates and so exist with fairly large “error bars” and uncertainty, but they are, for the most part, the best the evidence will support and serve to put meat on the bones of those standard generalizing descriptions of ancient society.
August 14, 2024
Premier Doug Ford’s weird plan to hold the justice system to account
The problem with Premier Ford’s as-yet-unelaborated plan to collect formal statistics on the products of the criminal justice system is that it’s weird. And Canadians don’t like weird things because something something Donald Trump something something Hitler. Despite that, Colby Cosh thinks it’s a good idea:

Superior Court of Justice building on University Avenue in Toronto (formerly the York County Court House).
… the very idea of addressing a social problem by gathering quantitative information is so un-Canadian as to seem radical and startling. It certainly seemed that way to the lawyers and civil libertarians who freaked out at Ford’s mention of “accountability” for judges who fail to protect the public from criminal predators.
Judicial independence is an axiom of our constitution — but to the degree that judges become policymakers, which is perpetually increasing as they discover creative new applications of the Charter, their lack of oversight by elected legislators and by the voting public is also a serious and obvious problem, purely in principle. It is no wonder the legal guild takes fright at the notion of “accountability” if it is interpreted to mean that judges might be subject to enforceable performance measures or firing by a minister.
But, of course, the word “account” is visible in there, and measurement of a social crisis is necessary to establish that one exists, even if almost everybody believes it to exist. Our courts are the first to castigate a government that makes some legislative change affecting individual rights without an attempt at inquiry into its reasonability and urgency. Ford, in proposing to establish the dimensions of preventable re-offending, is doing exactly what a legislator hoping to reduce crime ought to do: gather numbers. Collect and publish information. And let us specify that we mean publish publish, in an open, dependable, accessible way, with maximum detail.
Frankly, Ford’s announcement seems as much as anything like a reaction to being backed into a corner by an unresponsive Liberal government, which controls bail policy and the content of the Criminal Code, and by judges, whose irrational bail and sentencing decisions flood what’s left of our news media. Provincial politicians are bound to be judged by voters on the perceived prevalence of crime, but about all they can actually do about it is to, well, buy more choppers for the coppers and start collecting local data about revolving-door justice.
Update: Fixed broken link.
July 20, 2024
QotD: Comparing gun crime in Canada and the United States
Whatever, dude. Unlike Moore, I have homes on both sides of the border and it’s the Quebec one I keep locked. By the time you read this, I’ll be in New York, but my home in New Hampshire will be unlocked, and so will my car at the airport, the key in the ignition, so I’ll know where to find it. By contrast, in Quebec it’s illegal to leave your car unlocked, even if you stop for a pee on an ice floe up by Hudson’s Bay. Pace Moore, Canada has vastly lower rates of handgun ownership. Long-gun ownership is much closer, but, statistically, Canadians are slightly more murderous than Americans in this sphere: in the US, there are 1.7 homicides per 100,000 long guns; in Canada, it’s 1.9. So European visitors to North America should be aware they’re more likely to be killed by a homicidal Canadian rifleman than an American one.
On the overall murder rate, if Moore’s interested in “cultural differences”, it seems odd that he should avoid the most obvious one. Alberta Report‘s Colby Cosh, a braver man than I, points out that black Americans are 13 per cent of the US population but commit over half the murders. Once you factor those out, non-black Americans murder at about the same rate as Canadians.
Mark Steyn, “Bowling for Columbine”, Steyn Online, 2002-11-30.
July 4, 2024
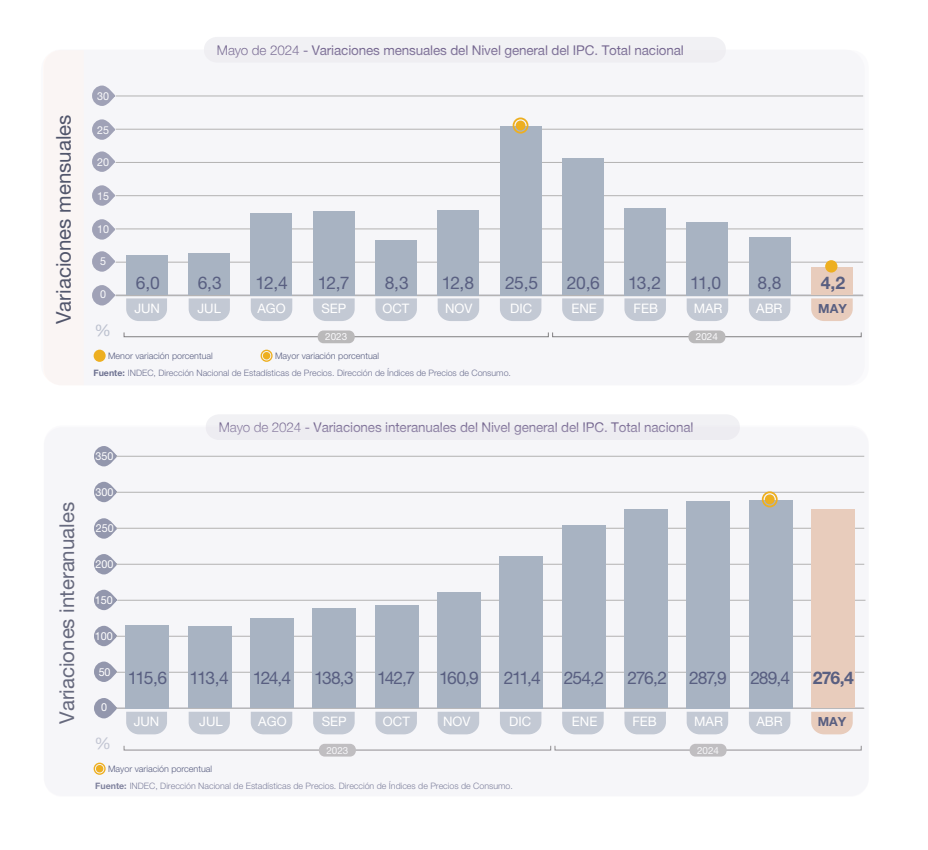
Argentina’s inflation rate
As you may have noticed, my interest in Argentinian affairs increased a lot with the election of Javier Milei as President. His first six months in office, while turbulent, do seem to have the economic indicators moving in the right direction for ordinary Argentines:
Argentina’s inflation rate has recently dropped to its lowest point since January 2022, registering a monthly increase of 4.2 percent in May according to the National Institute of Statistics and Census (INDEC). Although annual inflation has slowed for the first time since mid-2023, it still stands at 276.4 percent, one of the highest rates globally.
When Javier Milei assumed the presidency in December 2023, monthly inflation had skyrocketed to an unprecedented 25.5 percent. Within five months, Milei’s administration managed to reduce this figure by more than 20 percentage points. Despite the persistently high annual inflation rate, the trend indicates potential stabilization of the Argentine economy.
Javier Milei’s reforms have been described as aggressive. In his inaugural speech, he emphasized the need to clean up the economy before implementing his promises to dollarize and close the central bank.
To achieve a zero deficit, Milei enacted a 35 percent reduction in public spending. He achieved this by closing half of the ministries and secretariats, suspending public works for a year, reducing subsidies for energy and transportation, canceling government advertising, and maintaining the 2023 budget for 2024 despite an inflation rate of 300 percent. Essentially, the government drastically cut its expenditures.
These measures, although unpopular, yielded results. Milei’s government not only avoided a deficit, but achieved a surplus, and most importantly, inflation began to decline.
Following the inflation story in Argentina recently brought to mind Henry Hazlitt’s famous 1978 article “Inflation in One Page“. As the title suggests, Hazlitt summarizes the causes and remedies of inflation in a brief and simple explanation. He argued that inflation is a consequence of government monetary policies, specifically excessive money printing due to unbalanced budgets caused by extravagant government spending.
June 14, 2024
Britain’s anti-gay hate crime epidemic
Andrew Doyle suggests you take the recent reports of burgeoning hate crime in Britain with a fair bit of salt, because the hate crime statistics are far from trustworthy:

When things like this can be reported as “hate crimes”, and the definition depends on the reporter’s assumption of hateful intent, you’re going to see a lot more “hate crimes”.
We all know by now that the Metro is an activist publication masquerading as a newspaper. And so we ought to approach with some caution its article this week claiming that the UK has seen a surge in hate crime against gay people. There’s even a handy rainbow-coloured map which pinpoints the most homophobic locations in the country. Thankfully St Ives isn’t on the list, so I won’t have to cancel my holiday.
What are we to make of the article’s claim that there has been a 462% increase in homophobic hate crime and a 1,426% increase in transphobic hate crime since 2012? The source for these remarkable figures is the House of Commons Hate Crime Statistics report. If true, it would seem to confirm activists’ claims that we are living in an anti-LGBTQIA+ hellhole.
The truth is not so melodramatic. The supposed escalation of hate crimes in the UK can be accounted for by the way in which they are now recorded. Police actively trawl for complaints, inviting citizens to report offensive comments or any action – criminal or otherwise – that the “victim” perceives to have been motivated by prejudice. No evidence of “hate” is required for it to be recorded as such, other than the assumption of the complainant. With such methodology in place, it is inevitable that the statistics will rise.
And perhaps that’s the whole point. The police in the UK are just one of the many major institutions that has been captured by intersectional ideology. Police are regularly seen dancing at Pride parades, driving rainbow-coloured cars, and harassing gender-critical women for wrongthink. In February 2021 in Merseyside – a county that tops the Metro‘s list of homophobic hate spots – police were photographed next to a digital advertisement which read “Being offensive is an offence”. This belief-system can only be sustained by the narrative of widespread hate, and so we should not be surprised to see that police practice has been modified to ensure this outcome.
In fact, the College of Policing had made it clear that a fall in hate crime statistics would not be acceptable. Its operational guidance says that “targets that see success as reducing hate crime are not appropriate”. And by the Home Office’s own admission, “increases in police-recorded hate crime in recent years have been driven by improvements in crime recording and a better identification of what constitutes a hate crime”. In other words, there is no hate crime epidemic at all. It’s simply that the definitions have expanded.
Rather than rely on the Home Office statistics, we would be better turning to a source that hasn’t been corrupted by ideology. The Crime Survey for England and Wales hasn’t adopted the new police methods of recording, and shows that hate crime has been consistently dropping. Between 2008 and 2020, the number of hate crimes fell by 38%, and all the while records of hate crime kept by the police kept on rising. The disparity between the reality and the narrative couldn’t be more stark.
June 7, 2024
Since 2015, the Trudeau Liberals have done a fantastic job of suppressing the Canadian economy
If Canadians elected Justin Trudeau and the Liberal Party to make major changes from what had gone on under Stephen Harper’s Conservatives, then they got their wish in so many different ways, but especially economically:
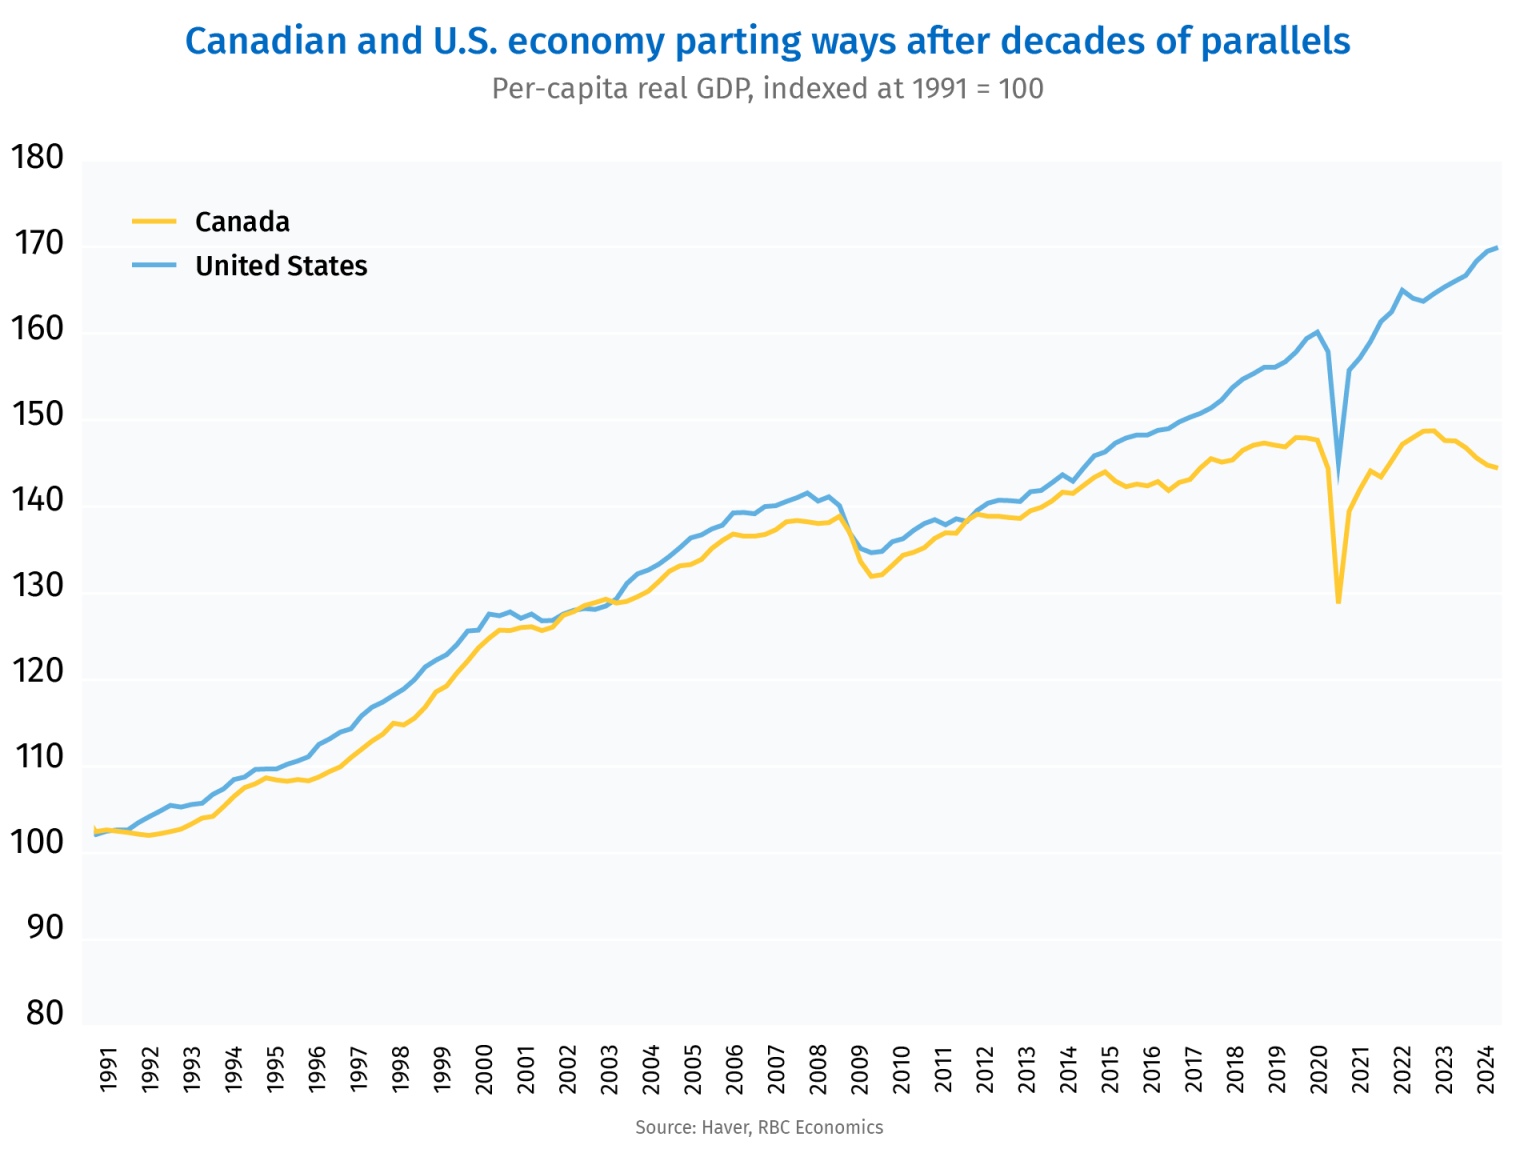
Reports of Canada’s dismal economic outcomes seem never to end. Why should they? For years Canadians have had the same federal government delivering the same deleterious economic policies and the same expansion in regulatory initiatives and spending that have invariably depressed economies and reduced standards of living whenever and wherever they are imposed. Therefore, until the federal government or its policies change, we should not expect the miserable results to materially improve.
The latest negative report is the release of Canada’s 2024-Q1 GDP numbers on Friday, which again showed sluggish growth relative to population, resulting in yet another quarterly decline in real GDP per capita. Relative to 2015-Q3, the last full quarter before the Trudeau government took office, cumulative real GDP per capita is up only about 0.7 per cent. A recent RBC Economics analysis showed from around 1991 to 2015, cumulative real GDP per capita growth in Canada approximately tracked with the U.S., but not since Justin Trudeau took office. Compared to 0.7 per cent growth in Canada from 2015-Q3 to 2024-Q1, real GDP per capita is up 15.7 per cent in the U.S. in the same time period.
Where the 0.7 per cent comes from matters, too. In real per capita terms, some components of GDP — mainly government — expanded while others contracted. Alarmingly, business investment, which drives productivity and standards of living, is down 13.9 per cent. This includes real per capita reductions of 15.2 per cent in residential structures, 18.4 per cent in machinery and equipment, and 19.3 per cent in non-residential structures, with an increase in intellectual property investment not nearly enough to offset the reductions in other categories.
To understand why business investment and economic performance in Canada are so poor under the Trudeau government, let us consider the following representative example of its economic strategy.
The government believes many families struggle with the cost of caring for young children, which is a legitimate concern. A reasonable solution, which the Harper government implemented in 2006, is to send money to families with young children and let parents buy for their children what they need. After the Liberals expanded that program, they could have left it at that, but what have they done instead? The government initiated a national takeover of child care, effectively expropriating child care entrepreneurs’ businesses by flooding their sector with public money and then controlling private companies’ revenues and operations. The result is child care entrepreneurs’ investments have been wiped out or severely reduced, control of their business operations have been wrestled away by government, and they are unable to properly serve their customers (the families), as evidenced by the drastic reduction in parental options and widespread shortages.
May 22, 2024
If you re-define it carefully, you can make any statistical measure look hopeful
In his Substack, Tim Worstall jokingly called this piece “Larry Summers Explains Why Americans Hate Joe Biden”:
As a good Democrat of course Larry Summers would never put things in quite that headline way. But the implication of this latest paper with others is to explain why Americans really aren’t as happy as they should be given the economic numbers. The answer being that the economic numbers we all look at to explain how happy folk are aren’t the right economic numbers to explain how happy people are.
We can also make — possibly rightly, possibly wrongly, this might be me projecting more than is merited — a further claim. That Americans simply aren’t as rich as those standard economic numbers suggest either. Which would also neatly explain the general down in the dumps attitude toward the economy.
So, the new paper:
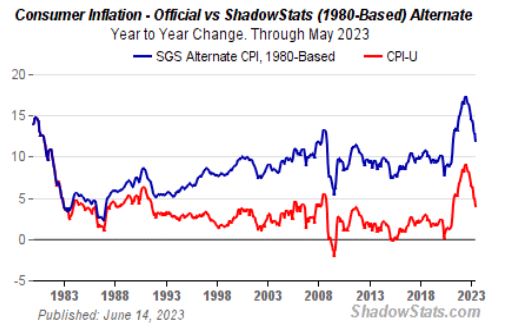
Unemployment is low and inflation is falling, but consumer sentiment remains depressed. This has confounded economists, who historically rely on these two variables to gauge how consumers feel about the economy. We propose that borrowing costs, which have grown at rates they had not reached in decades, do much to explain this gap. The cost of money is not currently included in traditional price indexes, indicating a disconnect between the measures favored by economists and the effective costs borne by consumers. We show that the lows in US consumer sentiment that cannot be explained by unemployment and official inflation are strongly correlated with borrowing costs and consumer credit supply. Concerns over borrowing costs, which have historically tracked the cost of money, are at their highest levels since the Volcker-era. We then develop alternative measures of inflation that include borrowing costs and can account for almost three quarters of the gap in US consumer sentiment in 2023. Global evidence shows that consumer sentiment gaps across countries are also strongly correlated with changes in interest rates. Proposed U.S.-specific factors do not find much supportive evidence abroad.
OK, or as explained by the Telegraph:
In it, the authors made a shocking claim: if inflation was measured in the same way that it was measured during the last bout of price rises in the 1970s, data showed that it peaked at 18pc in November 2022. This is far higher than the 9.1pc peak inflation shown by the official data.
The reason for this discrepancy is that, since the 1970s, economists have removed the cost of borrowing from the Consumer Price Index (CPI). The motivations here were not nefarious. The reasoning of the statisticians had something to it.
And, OK, if inflation peaked at 18%, not 9%, then that would explain why folk are pissed. Sure it would.
[…]
OK. But that means that if inflation was higher than we’ve been using then the deflation of nominal to real GDP is also wrong. Just that one year of 9% recorded but 18% by this new measure is damn near a 10% difference. That’s how much we’re over-estimating real GDP by right now. Add in a couple of years of lower levels of that and being 20% out wouldn’t surprise.
Which would mean that — if this were true and I might be overegging it — Americans are in fact 20% poorer than the Biden Admin keeps saying they are. And yes, that would piss the voters off, wouldn’t it?
Gaslighting has been a staple of the legacy media for quite some time now, going into high gear during the 2016 US Presidential elections and then into overdrive during the pandemic. They probably don’t even realize they’re doing it any more, because it feels “normal” to them. Yet they wonder why their popularity and public trust in their pronouncements continues to drop.
April 23, 2024
Debating the economic impact of the Raj on India
At The Daily Sceptic, Nigel Biggar looks at a few books making or refuting the narrative on how much or how little British rule in India extracted or contributed to the economic life of the subcontinent:
Beyond slave-trading and slavery, what were the economic effects of British imperial dominance? Can they be reduced to Britain’s leeching wealth from exploited subject peoples?
For over a century, that is what Indian nationalists have claimed. It is also what the politician Shashi Tharoor claims in his 2016 book, Inglorious Empire: What the British Did to India. Against him, however, the Bengali-born, LSE-based economic historian Tirthankar Roy has declared of the nationalist critique that “generations of historians … have shown that it is not [true]”. Pace Tharoor, the statistic that India produced 25 per cent of world output in 1800 and 2–4 per cent in 1900 does not prove that India was once rich and became poor: “[i]t only tells that industrial productivity in the West increased four to six times during this period … The proposition that the Empire was at bottom a mechanism of surplus appropriation and transfer has not fared well in global history”.
On the contrary, the British Empire’s commitment to free trade gave Indian entrepreneurs new opportunities to grow. Some of them visited England in the late 19th Century, observed the workings of manufacturing industry, imported machinery and expertise to India, built factories employing Indians, and then outcompeted Manchester. This is exactly how the Tata Iron and Steel Company began in Bombay – the same company that now owns what remains of the British steel industry.
What is more, colonial governments often protected native producers against British business, in order to moderate economic and social disruption, partly because they genuinely cared for the welfare of native people and partly because they didn’t want to have to manage the political unrest that foreign commercial intrusion could excite. Famously, in 1910-11 colonial officials barred Lever Brothers from acquiring concessions in Nigeria on which to establish palm-oil processing mills with widespread hinterlands, since Africans were already producing for the world markets and generating tax revenue and because the alienation of large areas of land risked provoking native opposition.
Further still, the British were the leading exporters of capital from the mid-19th Century to at least 1929. Between 1876 and 1914, Britain invested over a third of its overseas capital in the Empire, over 19% of it in India. Of course, British investors often made a profit out of this. That’s the thing about investment: you tend to want to grow your money, not waste it. But if the British gained, so did colonial peoples. Take railways. By 1947, British India had 45,000 miles of railway track, most of it constructed with private capital, whereas five years later un-colonised China still had less than 18,000 miles. For sure, the railways served military purposes. But they also served commercial and economic ones: one estimate reckons that when the railway network reached the average district, real agricultural income rose by about 16%. And it served the welfare purpose of efficient famine relief, too.
A basic reason why the British sent their capital overseas to the Empire, enabling the growth of businesses and the building of infrastructure, was that colonial states provided sufficient political stability and legal certainty to make the risks of financial ventures worth taking. (Badenoch hints at this in her reference to the economic effects of the Glorious Revolution of 1688.) That explains why Australia’s economic growth compares so favourably with that of many Latin American countries, and why, between the 1860s and 1890s, Australia was the richest country on earth.
In sum, the considered judgement of the Swiss historian Rudolf von Albertini, whose work – according to the world’s “leading imperial economic historian”, David Fieldhouse – was based “on exhaustive examination of the literature on most parts of the colonial world to 1940”, was simply this: “colonial economics cannot be understood through concepts such as plunder economics and exploitation”.
QotD: Who cares about you?
Alchian, donning a mischievous smile asked, “Williams, have you considered a third alternative, namely, that people don’t give a damn about you one way or another?” Initially, I felt a bit insulted, and our conversation didn’t go much further, but that was typical of Alchian — saying something profound, perhaps controversial, without much comment and letting you think it out.
Years later, I gave Alchian’s third alternative considerable thought and concluded that he was right. The most reliable assumption, in terms of the conduct of one’s life, is to assume that people don’t care about you one way or another. It’s an error to generalize that people are friends or enemies, or that people are out to either help you or hurt you. To put it more crudely, as Alchian did, people don’t give a damn about you one way or another.
Walter E. Williams, “Who Cares About You?”, Townhall.com, 2019-10-01.


