In City Journal, Catesby Leigh looks at (and shudders at) some of the best-known examples of Brutalist architecture in the UK:
World War II left Britain in urgent need of rebuilding. The Blitz destroyed 200,000 homes and left another quarter-million uninhabitable. In the severely overcrowded urban slums, often blighted by industrial pollution, families lived without indoor plumbing, and they shared outdoor privies with neighbors. Others found shelter in temporary prefabricated homes produced by the aviation industry. In 1946, the government legislated the creation of new towns that, along with extensions of existing ones, would eventually be home to more than 2 million Britons. Aside from the new towns, a multitude of urban renewal and greenfield-development schemes emerged during the economically vigorous 1950s and 1960s. Housing “estates” erected by city and other local councils, mainly for lower-income residents, sprang up at a vertiginous rate, along with new office buildings, civic centers, shopping centers, parking garages, schools, hospitals, factories, and university buildings. Some 1.5 million prewar homes were demolished in the three decades following the war. Old urban centers were transformed: “Post-war Birmingham rebuilt itself in austere raw concrete, like Kuwait and Hanover and Manila,” Christopher Beanland enthuses in Concrete Concept: Brutalist Buildings Around the World. But by the late 1960s, it was obvious that most Englishmen weren’t keen on the idea of Birmingham looking like Kuwait and Hanover and Manila.
[…]
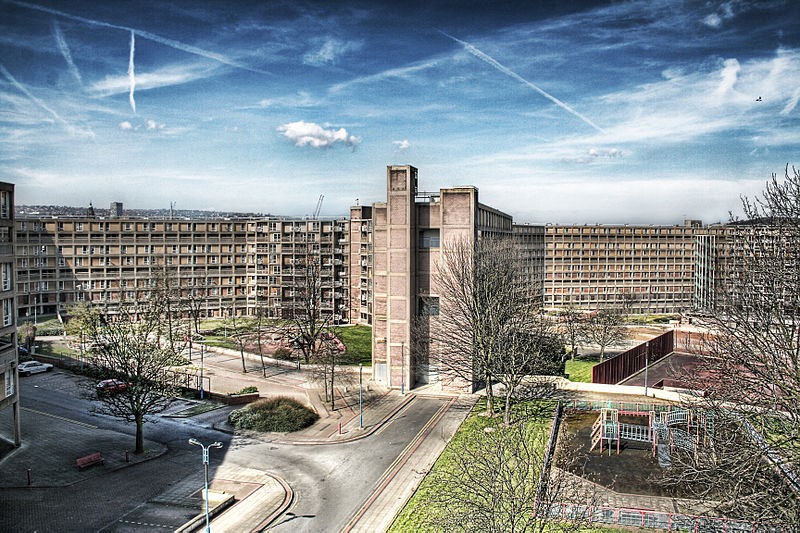
Park Hill, half-abandoned council housing estate, Sheffield, England
Photo via Wikimedia CommonsMany of the buildings that Harwood’s book covers make you wonder whether it is really about architecture at all. Consider Park Hill (1961), a huge council-housing estate containing nearly 1,000 duplexes and single-level flats that partially replaced a demolished slum overlooking downtown Sheffield — a crime-ridden precinct that, for all its problems, had housed a resilient community. Laid out as four long, interconnected slabs inflected so as to form an utterly antiurban, vermiculated footprint, Park Hill owed an enormous debt to the Unité d’habitation. At every third story, it featured elevated open-air “streets” or “decks” — the Corbusian fetish of the day — that ran indoors and out, connecting the slabs. As at the Unité, the imagery was nakedly industrial, with the apartments stashed in a “bottle-rack” grid of concrete that soon assumed a depressingly drab tincture and also proved prone to spalling. A ruthless rationalism likewise asserted itself in the level height maintained throughout the complex, which ranged from four to 13 stories, despite the irregular, sloping site. Park Hill was less a work of architecture than a huge, strange contraption inflicted on the urban skyline. Visual amenity, such as it was, came in the form of soft-hued brick within the concrete grid.
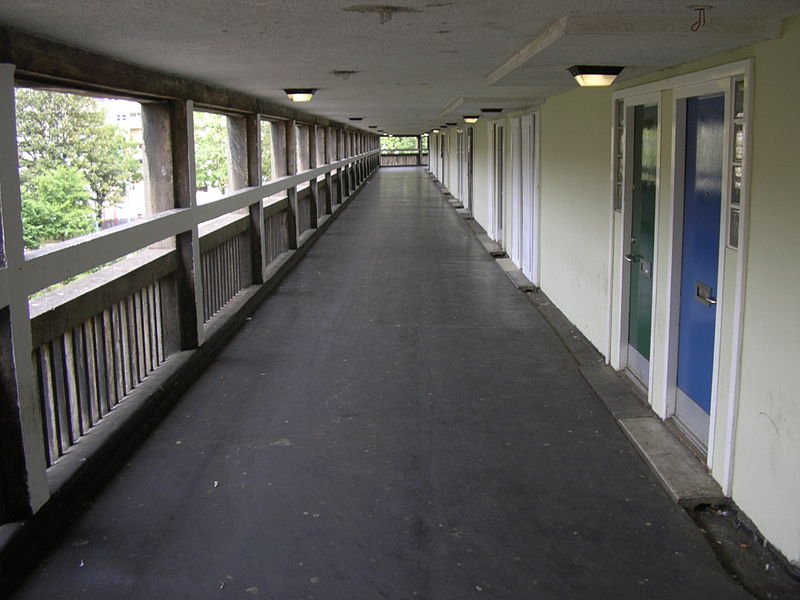
A typical deck in the Park Hill Flats, Sheffield.
Photo via Wikimedia Commons.As with many postwar housing projects, Park Hill offered practical amenities that residents had never before enjoyed: indoor plumbing, hot water, mechanical heating, even a sophisticated garbage-disposal system. Harwood mentions that, Britain’s many council-housing catastrophes notwithstanding, Park Hill “stood firm.” This is not true. By 1979, less than 20 years after its completion, Park Hill was an urban basket case — riddled with graffiti, terrorized by hooligans, afflicted with irruptions of black mold and the terrible stench resulting from waste-disposal blockages. Deserted decks and stairways provided criminals with multiple escape routes.
[…]
Local journalist Peter Tuffrey’s Sheffield Flats, Park Hill and Hyde Park: Hope, Eyesore, Heritage — whose title might seem to play ironically off Harwood’s but for the fact that the book appeared two years earlier — allows us to study a map and old photographs of the slum that Park Hill and Hyde Park supplanted. What we see are blocks, courts, and alleys teeming with row houses and low-rise tenements — streetscapes displaying a human scale, much solid construction, and considerable dereliction, all to be swept away by the desolation of the Corbusian superblocks.
Harwood doesn’t trouble herself with the Hulme Crescents (1972), another assemblage of concrete slabs on the vermiculated, “streets-in-the-sky” plan that rose from the blank slate of a demolished Manchester working-class district where 90,000 people once lived — “the human engine-room of the Industrial Revolution,” as Lynsey Hanley calls it in her largely autobiographical and often engrossing Estates: An Intimate History. The Crescents, designed to house more than 13,000, were conceived in emulation of Bath, the gorgeous Georgian city. Things didn’t work out that way.
“Almost immediately, the estate’s infrastructure began to suffer from the same problems that beset Park Hill and Broadwater Farm [a troubled north London estate]: leaky roof membranes, infestations of vermin and insects, uncontrollable damp, deserted walkways, and an endemic feeling of isolation,” Hanley notes. “The flats were so expensive to warm that many tenants never turned the central heating on, and communal areas were so difficult to maintain that the [city] council could not cope. When a small child died after falling off the top-floor ‘access deck’ of one of the Crescents in 1974, families decamped to the outskirts, belatedly following the rest of old Hulme.” The Crescents’ descent into chaos did make it possible for an anarchic punk scene to flourish in an upper-level hangout known as The Kitchen. The party ended with the estate’s demolition during the 1990s.
[…]
Still, the folly of concentrating lower-income populations in tall buildings eludes her, just as it eluded the Tory government that, in 1956, introduced hugely generous subsidies for the construction of high-rises, relative to row houses and semidetached houses. Not only are tall buildings much more expensive to build and maintain than houses; they were not even essential to achieving the residential densities that postwar planners sought. Tall buildings are highly artificial and complex structures housing temperamental machines, like elevators, that require a heightened degree of maintenance, often by highly paid technicians rather than handymen with toolboxes and stepladders, as Hanley observes. Tall buildings also require an elevated degree of social discipline, as well as security features like intercom systems, closed-circuit TV, and doormen or concierges. The tower blocks and high-rise slabs at the Barbican Estate, the carefully developed, elaborately landscaped, intensely picturesque Brutalist “bankers’ commune” in the City of London, have been very successful. The appropriate synecdoche for the Barbican’s low-end counterparts, however, might well be a broken-down elevator littered with trash, defaced by graffiti, and reeking of urine.