Celina considers the claim that the period of British rule over India was a period of British plunder of Indian resources:
The historical evaluation of the British Raj has increasingly become a battleground for competing political and academic narratives. In the 21st century, the discourse has shifted significantly toward an oppression narrative that characterises the period from 1757 to 1948 as one of singular depredation. This perspective, popularised by public intellectuals such as Shashi Tharoor and economic historians like Utsa Patnaik, posits that British rule was defined by systematic deindustrialisation, engineered genocide, the intentional dismantling of educational systems, and the looting of wealth on a scale that defies standard economic modelling.1 However, when subjected to the rigours of aggregate statistical data, comparative institutional analysis, and a sense of historical proportion, these claims frequently reveal themselves as founded on misleading anecdotes and founding myths rather than objective economic realities.2 To accurately understand the trajectory of India under British influence, it is essential to move beyond evocative stories, such as Winston Churchill’s peevish marginal notes and examine the underlying population trajectories, industrial output figures, and the structural transition from a traditional to a constructed capitalist economy.3
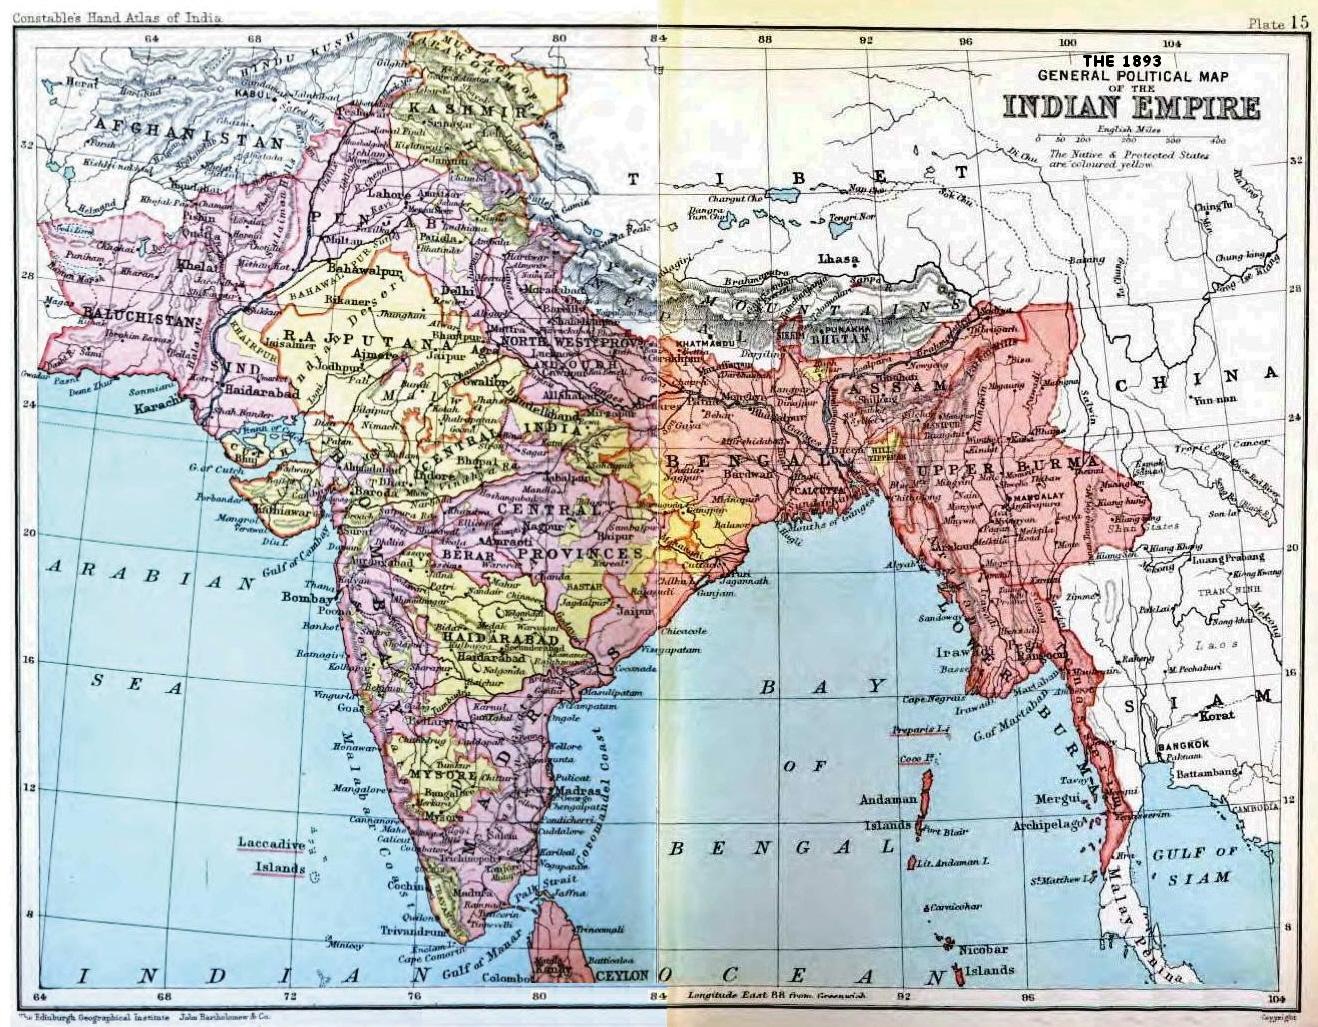
“Political Map of the Indian Empire, 1893” from Constable’s Hand Atlas of India, London: Archibald Constable and Sons, 1893. (via Wikimedia)
Chronology and the Context of the Great Divergence
A critical assessment must begin with a precise periodisation of Indian history. The interaction between Europe and the subcontinent can be divided into four distinct phases: the pre-European period (before 1505), the era of initial coastal contact and Portuguese outposts (1505–1757), the transition under the East India Company (1757–1818), and the era of English domination and formal Raj rule (1818–1948).4 The central contention of modern critics centers on the final period, arguing that India’s share of the global economy collapsed from approximately 24.4% in 1700 to roughly 4.2% by 1950.5
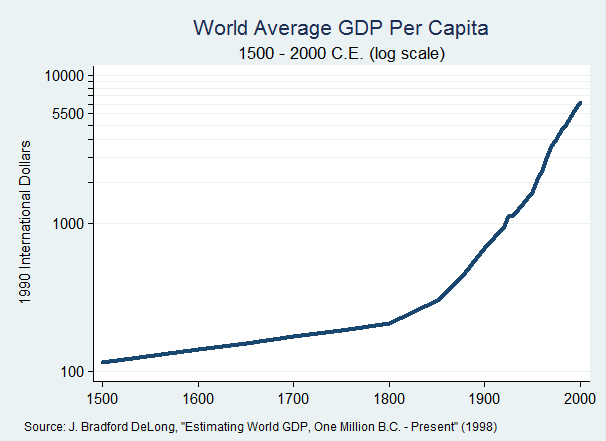
While these proportions are grounded in data, most notably the work of Angus Maddison, the interpretation of this decline as evidence of absolute impoverishment is a fundamental statistical fallacy. The decline in India’s share of world GDP was not the result of a shrinking absolute economy, but rather the consequence of the Great Divergence. During this period, Western Europe, North America, and eventually Japan experienced explosive, intensive growth through the Industrial Revolution, while India remained largely stationary.6
Between 1850 and 1947, India’s absolute GDP in 1990 international dollar terms actually grew from $125.7 billion to $213.7 billion, representing a 70% increase.7 The stagnation in per capita terms, GDP per capita was approximately $550 in 1700 and $619 in 1950, reflects a classic Malthusian trap.8 The unprecedented population growth stimulated by the introduction of Western medicine, increased land cultivation, and the relative political stability of the Raj absorbed almost all economic gains.9 Far from being genocided, the Indian population expanded from 165 million in 1700 to nearly 390 million by 1941.10
- https://en.wikipedia.org/wiki/Shashi_Tharoor%27s_Oxford_Union_speech
- https://winstonchurchill.hillsdale.edu/tharoor-inglorious-empire/
- https://www.reddit.com/r/AskHistorians/comments/l9nve2/he_peevishely_wrote_on_the_margins_of_the_file/
- https://en.wikipedia.org/wiki/Economic_history_of_India
- Ibid
- https://winstonchurchill.hillsdale.edu/tharoor-inglorious-empire/
- https://www.rug.nl/ggdc/historicaldevelopment/maddison/
- Ibid
- https://winstonchurchill.hillsdale.edu/tharoor-inglorious-empire/
- https://www.rug.nl/ggdc/historicaldevelopment/maddison/