Quotulatiousness

June 21, 2019

Lies, damned lies, and hate crime statistics

Filed under: Britain, Law, Media — Tags: , , , , , , — Nicholas @ 03:00

Fraser Myers explains why the much-remarked-upon British crime statistics showing huge increases in hate crimes are much more a statistical artifact than a true reflection of the state of British society:

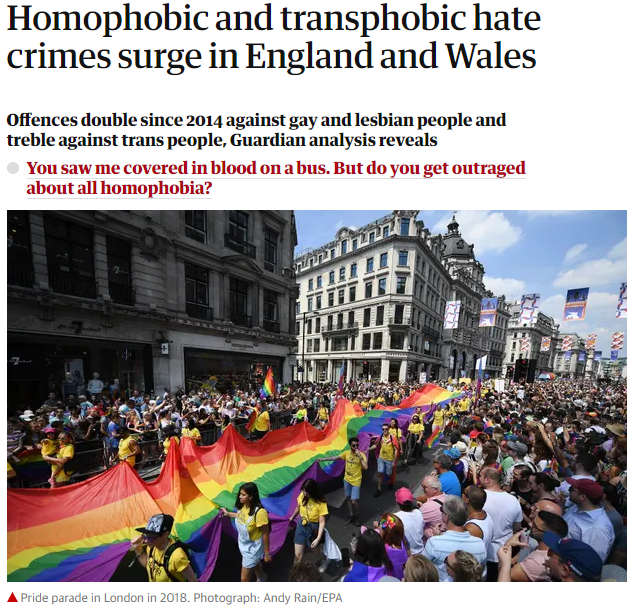
Allegedly, England and Wales are in the grip of a “surge” in homophobic and transphobic hate crime. “The rate of LGBT hate crime per capita rose by 144 per cent between 2013-14 and 2017-18”, it reports. Hate-crime hotspots like South Yorkshire and Hampshire experienced even larger surges, it claims, with police-recorded crimes rising by 376 per cent and 189 per cent in the same period, respectively.

To make matters worse, according to LBGT campaigners, this rise in hate crime doesn’t even capture the true extent of the hatred out there. Taz Edwards-White, alliance manager at equalities and diversity organisation Metro, told the Guardian that the hate-crime figures were likely to be “the tip of the iceberg”. She and other campaigners say this rise could be down to the rise of right-wing populism.

The truth is rather different. Every year for the past five years, the release of police-recorded data on hate crime has been accompanied by panicked media reports of a hate-crime surge. But as last year’s Home Office report made abundantly clear, large increases “are due to the improvements made by the police in their identification and recording of hate-crime offences and more people coming forward to report these crimes rather than a genuine increase” (emphasis mine).

What’s more, there is a good reason why the “surge” identified by the Guardian takes off in 2013-2014. 2014 was the year the College of Policing released its Hate Crime Operational Guidance [PDF], which is still used to this day. This guidance actually demands that the numbers increase. “Targets that see success as reducing hate crime are not appropriate”, it says. As part of the drive to record more crime, there has been a slew of public-information campaigns and regular exhortations from police for the public to report hateful incidents, particularly in the wake of major political events like the EU referendum and the 2017 terror attacks.

Police-recorded data has other problems, too. Police are obliged to record not only criminal actions but also all non-crime hate incidents. A non-crime hate incident is literally any event that is perceived by the victim or any other person to be motivated by hostility towards a so-called protected characteristic. The key word here is perceived. As the Operational Guidance makes clear: “The victim does not have to justify or provide evidence of their belief, and police officers or staff should not directly challenge this perception. Evidence of the hostility is not required for an incident or crime to be recorded as a hate crime or hate incidents.”

QotD: Caloric intake and weight gain

Filed under: Food, Health, Quotations, Science — Tags: , , — Nicholas @ 01:00

The average person needs about 800,000 calories per year. And it takes about 3,500 extra calories to gain a pound of weight. So if somebody stays about the same weight for a year, it means they fulfilled their 800,000 calorie requirement to within a tolerance of 3,500 calories, ie they were able to match their food intake to their caloric needs with 99.5% accuracy.

By this measure, even people who gain five or ten pounds a year are doing remarkably well, falling short of perfection by only a few percent. It’s not quite true that someone who gains five pounds is ((5*3,500)/800,000) = 98% accurate, because each pound you gain increases caloric requirements in a negative feedback loop, but it’s somewhere along those lines.

Take a second to think about that. Can you, armed with your FitBit and nutritional labeling information, accurately calculate how many calories you burn in a given day, and decide what amount of food you need to eat to compensate for it, within 10%? I think even the most obsessive personal trainer would consider that a tall order. But even the worst overeaters are subconsciously managing that all the time. However many double bacon cheeseburgers they appear to be eating in a single sitting, over the long term their body is going to do some kind of magic to get them to within a few percent of the calorie intake they need.

It’s not surprising that people overeat, it’s surprising that people don’t overeat much more. Consider someone who just has bad impulse control and so eats whatever they see – wouldn’t we expect them to deviate from ideal calorie input by more than a few percent, given that this person probably has no idea what their ideal input even is and maybe has never heard of calories?

Scott Alexander, “Book Review: The Hungry Brain”, Slate Star Codex, 2017-04-27.

June 6, 2019

New paper on minimum wage effects is bound to be mis-used

Filed under: Economics, Politics, USA — Tags: , , , — Nicholas @ 05:00

In the Washington Examiner, Tim Worstall explains why a new well-researched paper on the minimum wage will be misunderstood and then used to “prove” things it doesn’t actually say:

None of this changes the standard intuition that when there’s a heavy such bite then there will be ill effects. What it does do is then lead us to trying to calculate what is a wage that does have that snarl, that bite? What is a minimum wage that is “too high” in the sense of having an excess of those ill effects upon employment? This is where I predict — no, not fear, not posit, nor surmise, but predict — this paper will be misused.

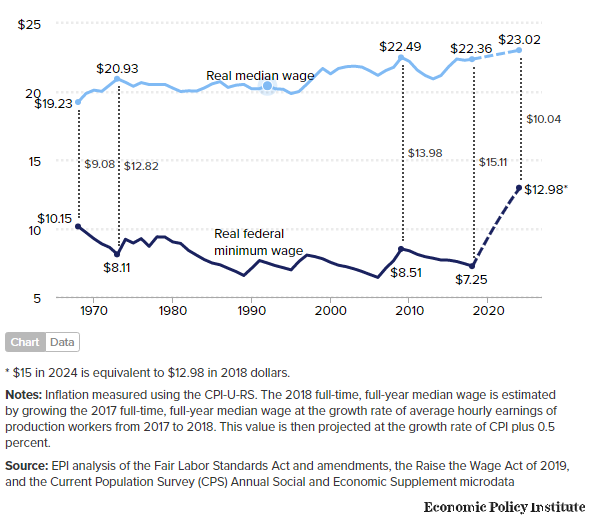
Our thinking is that the effects come from the relationship between the minimum and median wages. If we insist that wages cannot be lower than more than we already pay half the people, then we really are going to have problems. A minimum wage of 100% of the median wage isn’t going to work, that is. That ratio is called the Kaitz Index. This paper shows us that there are few to no such bad things happening up to 0.59 on that Kaitz measure. We can have the minimum wage at 59% of the median wage and know that we’ll have the good effects and only trivial amounts, at worst, of the bad.

You can see what’s going to happen next, can’t you? The Economic Policy Institute tells us that the median wage is about $22 this year, and 59% of that is $13. A bit of rounding and some aspiration, and why not go for a $15 minimum wage?

Except there are two median wages. Part-time and seasonal wages tend to be lower than full-year and full-time ones. The Economic Policy Institute is using that higher full-time one. The one for all jobs is quite a bit lower, $18.58 per hour. Take 59% of that and you get a rather lower level of $10.95 an hour. That’s around and about what McDonald’s, Walmart, and similar establishments pay as entry-level wages, which does seem about right, doesn’t it?

So, the new research paper, from esteemed researchers, published in the world’s top English language economics journal, tells us that minimum wages up to a certain level cause few to no problems. They’ve shown this for up to 59% of median wages. But which median do they mean? Dube himself told me they mean that lower one — specifically, the “median wage of all workers, not just for full time.”

But we all know how this is going to be used, don’t we? As proof that $15 an hour won’t cause any problems — which isn’t what the paper shows at all. Rather, it says that a $10.95 an hour minimum wage shouldn’t cause any problems of note.

The new paper is good empirical work. The fault is in what people will argue it says, not what it does.

April 18, 2019

QotD: Roadblocks to deregulating the US healthcare market

Filed under: Bureaucracy, Government, Health, Quotations, USA — Tags: , , , — Nicholas @ 01:00

One problem America has is simply that our government administration isn’t very good. That’s not true across the board — our government statistics are, IMHO, the finest in the world. But there’s stuff that other countries can do that we can’t, either because our government is more decentralized, or because our civil service just isn’t as prestigious (and therefore as full of competent, motivated people) as those in other countries. And our regulatory approach — rules rather than principles based, and highly adversarial — is also suboptimal, and hard to change.

Given how much the government now interferes in health care, that’s a big problem. Given our lack of administrative competency, our first step should be pulling back where we can — trying to push more ordinary expenses onto consumers, for example, who can manage those the same way they manage their aspirin and antacid purchases now. And eliminating the tax deduction for employer sponsored health care would be major. But I fear, politically impossible.

Megan McArdle, “Ask Me Anything”, Reddit, 2017-04-10.

March 10, 2019

QotD: Surnames and taxes

Filed under: Europe, History, Quotations — Tags: , , , , , — Nicholas @ 01:00

… (related: Scott examined some of the same data about Holocaust survival rates as Eichmann In Jerusalem, but made them make a lot more sense: the greater the legibility of the state, the worse for the Jews. One reason Jewish survival in the Netherlands was so low was because the Netherlands had a very accurate census of how many Jews there were and where they lived; sometimes officials saved Jews by literally burning census records).

Centralized government projects promoting legibility have always been a two-steps-forward, one-step back sort of thing. The government very gradually expands its reach near the capital where its power is strongest, to peasants whom it knows will try to thwart it as soon as its back is turned, and then if its decrees survive it pushes outward toward the hinterlands.

Scott describes the spread of surnames. Peasants didn’t like permanent surnames. Their own system was quite reasonable for them: John the baker was John Baker, John the blacksmith was John Smith, John who lived under the hill was John Underhill, John who was really short was John Short. The same person might be John Smith and John Underhill in different contexts, where his status as a blacksmith or place of origin was more important.

But the government insisted on giving everyone a single permanent name, unique for the village, and tracking who was in the same family as whom. Resistance was intense:

    What evidence we have suggests that second names of any kind became rare as distance from the state’s fiscal reach increased. Whereas one-third of the housholds in Florence declared a second name, the proportion dropped to one-fifth for secondary towns and to one-tenth in the countryside. It was not until the seventeenth century that family names crystallized in the most remote and poorest areas of Tuscany – the areas that would have had the least contact with officialdom. […]

    State naming practices, like state mapping practices, were inevitably associated with taxes (labor, military service, grain, revenue) and hence aroused popular resistance. The great English peasant rising of 1381 (often called the Wat Tyler Rebellion) is attributed to an unprecedented decade of registration and assessments of poll taxes. For English as well as for Tuscan peasants, a census of all adult males could not but appear ominous, if not ruinous.

Scott Alexander, “Book Review: Seeing Like a State”, Slate Star Codex, 2017-03-16.

March 9, 2019

Old posts (from the old blog) about Chinese official economic statistics

Filed under: China, Economics, Media — Tags: , , , , , — Nicholas @ 03:00

This post at Continental Telegraph a few days back reminded me I wanted to get around to gathering some of my older posts about the reasons to take the official GDP numbers from the Chinese government with more than just a pinch of salt. Here’s my very first rant on the topic from 10 August, 2004 (original expired URL – http://bolditalic.com/quotulatiousness_archive/000323.html):

On my way in to work this morning, I heard a stock advisor doing his best to make reasonable assumptions about what the average listener needed to know about the economy. This guy has been pretty level-headed in the past, but this morning’s talk just got my head ready to explode.

The topic of discussion was the Chinese economy and how the Chinese central bank was having to take greater efforts to rein in economic expansion. He talked about how many different sectors of the North American economy were, to greater or lesser degree, depending more and more on Chinese growth to increase their own investments and output. The idea that the Chinese economy was "overheating" was bandied about. He closed by indicating that a slight drop in the official growth rate from 9.8% to 9.6% showed that the Chinese central bank was seeing some results from their intervention in the economy.

There are so many things wrong here that I’m almost at a loss where to start. While there is no doubt that China is a fast-growing economy, the most common mistake among both investors and pundits is to assume that China is really just like South Carolina or Ireland … a formerly depressed area now achieving good results from modernization. The problem is that China is not just the next Atlanta or Slovenia. China is still, more or less, a command economy with a capitalist face. One of the biggest players in the Chinese economy is the army, and not just in the sense of being a big purchaser of capital goods (like the United States Army, for example).

The Chinese army owns or controls huge sectors of the economy, and runs them in the same way it would run a division or an army corps. The very term "command economy" would seem to have been minted to describe this situation. The numbers reported by these "companies" bear about the same resemblance to reality as those posted by Enron or Worldcom. With so much of their economy not subject to profit and loss, every figure from China must be viewed as nothing more than a guess (at best) or active disinformation.

Probably the only figures that can be depended upon for any remote accuracy would be the imports from other countries — as reported by the exporting firms, not by their importing counterparts — and the exports to other countries. All internal numbers are political, not economic. When a factory manager can be fired, he has his own financial future at stake. When he can be sentenced to 20 years of internal exile, he has his life at stake. There are few rewards for honesty in that sort of environment: and many inducements to go along with what you are told to do.

Under those circumstances, any growth figures are going to be aggregated from all sectors, most of which are under strong pressure to report the right numbers, not necessarily corresponding with any real measurement of economic activity. So, if the economic office wants to see a drop in the economy, that’s what they’ll get.

Basing your own personal financial plans on numbers like this would quickly have you living in a cardboard box under a highway overpass. Companies in the soi-disant free world have shareholders or owners to answer to. Companies in China exist in a totally different environment.

I returned to the same topic on October 25, 2004, triggered by yet another talking head on the radio under the heading “More Economic Voodoo — or is that Feng Shui?” (original URL – http://www.bolditalic.com/quotulatiousness_archive/000580.html):

Again this morning, I was listening to my local jazz radio station on the way in to work. As usual, they had a broker from CIBC Wood Gundy giving portfolio advice at about 9:20 a.m. Today’s talk was about investing in China, and how the markets have been reacting to the recent small drop in the official GDP growth figures released by the Chinese central bank.

This time, the emphasis was on the idea that in spite of the breathtaking growth figures, Chinese firms still are not particularly profitable and that therefore there are better ways of investing your money to benefit from all that growth. Unlike the last time I addressed this issue, this time I thought that the advisor was actually making pretty good sense. The incredible transformation of China from a pure command-driven economy to a mixed economy will certainly provide lots of opportunities for people to get rich; it will also provide even more opportunities to lose big money.

Much of the problem is that even now, the Chinese economy is not particularly free: the official and unofficial controls on the economy provide far too many opportunities for rent-seeking officialdom to play favourites and cripple antagonists (and for once, "cripple" is not just a bit of hyperbole). Any numbers provided by the Chinese authorities cannot be depended upon, and should probably only be viewed as an indication of what the Chinese government wants the outside world to believe.

Even in a relatively free economy like Canada, the underground economy can be huge, with plenty of economic activity happening out of reach of the taxman. In China, where everybody was raised in an environment where providing the "wrong" answer to your leader could get you imprisoned (or executed) as an economic criminal, the numbers upon which the bankers and financial officials depend can only be described as extremely unreliable.

Update 26 October: The Last Amazon asks a highly pertinent and pointed question:

    In the past week, the Globe and Mail has been featuring the economic engine that China has become. Its economy is thriving so much so that Chinese government owned companies like China Minmetals Corp (which had revenues in 2003 of USD$11.7 billion) is currently negotiating to buy outright 100% of the stock of the Canadian mining corporation, Noranda Inc. The total stock is estimated at approximately CDN$6.7 billion.

    If the Chinese government can afford to buy Noranda Inc. why hasn’t anyone asked when China will reimburse the overburdened Canadian taxpayers of this fair land for the Cdn$65.4 million that has been given to China as foreign aid?

I managed to stay away from the topic until April 13, 2007, when I posted “The Chinese Economy”, which largely quoted from my first two posts (old URL – http://bolditalic.netfirms.com/quotulatiousness_archive/003649.html):

Everyone must have heard many different variations on how incredible the Chinese economy is: spectacular growth, innovations galore, etc., etc. And there’s much truth to it — China has been industrializing at a mind-croggling pace. At least, the visual evidence says so. The economic data coming out of China is, to be kind, not as dependable as similar data from most other countries. […]

Three years on, I must retract a tiny bit there … Enron’s and Worldcom’s figures, while deliberately misleading, were refutable (and the culprits taken to court). […]

Samizdata links to a brief Tyler Cowen post which includes this quote:

    …of the 3,220 Chinese citizens with a personal wealth of 100 million yuan ($13 million) or more, 2,932 are children of high-level cadres. Of the key positions in the five industrial sectors – finance, foreign trade, land development, large-scale engineering and securities – 85% to 90% are held by children of high-level cadres.

That’s even higher than I expected. But it’s an excellent example of what I originally wrote about back in 2004: the economy isn’t free, and the beneficiaries are disproportionally those who are politically well-connected. Caveat investor.

And that was when I discovered that my “full” backup of files from the old site is actually missing nearly a year of posts from May 2008 to May 2009 (when I moved to the current site). I vaguely recall that Jon (my former virtual landlord) was having problems with limited storage on that site — I was just a freeloading guest — so perhaps one of the things we lost was the auto-archiving after we reached a certain capacity.

Thanks to the Wayback Machine, I found a couple of other entries but they were often just rehashes of the first two posts interspersed with quotations from articles I felt were being too Pollyanna-ish about the Chinese economic numbers, like this one from May 2, 2008:

Those untrustworthy Chinese economic numbers

Regular readers will know that I’ve been a long-term skeptic about the economic figures reported by the Chinese government (for example, here and here back in 2004). As a result, this post at the Economist is not very surprising:

    As China’s importance in the global economy increases, investors are paying more attention to its economic numbers. Yet the country’s official statistics are notoriously ropy. Some commentators accuse China’s government of overstating GDP growth for political reasons, others complain that the official inflation rate is fraudulently low. So which data can you trust?

    One reason to be suspicious of GDP figures is that China is always one of the first countries to report them, usually only two weeks after the end of each quarter. Most developed economies take between four and six weeks to produce them.

However, The Economist still feels that the Chinese economy is larger than reported. My sense of distrust in the figures argues for it being neither as big nor as robust as the reported figures indicate. They’re professional economic reporters … I’m a guy typing a blog entry. I wonder what the long-term odds are for either of us to be closer to the truth?

It’s tough to disagree with this, though:

    The prize for the dodgiest figures goes to the labour market. The quarterly urban unemployment rate is meaningless because it excludes workers laid off by state-owned firms as well as large numbers of migrant workers, who normally live in urban areas but are not registered. Wage figures are also lousy. There has recently been much concern about the faster pace of increase in average urban earnings. But this series does not cover private firms, which are where most jobs have been created in recent years.

    Now that China is such an engine of global growth, it urgently needs to improve its economic data. Only a madman would drive a juggernaut at full speed with a faulty speedometer, a cracked rear-view mirror and a misty windscreen.

By this point, Jon was referring to my obsession with bogus Chinese economic statistics as my “hobby horse” … yet it wasn’t unknown for him to send me links to articles on that very topic. Here’s another post, courtesy of the Wayback Machine, from January 23, 2009:

China’s economic situation

There’s an article at The Economist today that shows a touching belief in the magic of the Chinese economy. The reported Gross Domestic Product has fallen to “only” 5.8%. The Economist‘s writer spends much of the article worrying about this gloomy report:

    New figures show that China’s GDP growth fell to 6.8% in the year to the fourth quarter, down from 9% in the third quarter and half its 13% pace in 2007. Growth of 6.8% may still sound pretty robust, but it implies that growth was virtually zero on a seasonally adjusted basis in the fourth quarter.

    Industrial production has slowed even more sharply, growing by only 5.7% in the 12 months to December, compared with an 18% pace in late 2007. Thousands of factories have closed and millions of migrant workers have already lost their jobs. But there could be worse to come. Chinese exports are likely to drop further in coming months as world demand shrinks. Qu Hongbin, an economist at HSBC, forecasts that exports in the first quarter could be 19% lower than a year ago. 2009 may well see the first full-year decline in exports in more than a quarter of a century.

    Economists have become gloomier about China’s prospects, with many now predicting GDP growth of only 5-6% in 2009, the lowest for almost two decades.

I’ve blogged about the Chinese economy on a few occasions (most recently here), generally with the same concern: that the numbers reported cannot be relied upon. The same is true here. Interestingly, the Economist article I linked to back in May makes this point quite well, yet today’s article appears to treat the Chinese government’s numbers as solid.

China has changed substantially from twenty years ago, and in many ways for the better. Most ordinary Chinese today are more free — economically anyway — than they were a generation ago, and there is a lot more opportunity for individuals to set up businesses and to succeed without needing Party connections. All this is indisputable … yet vast swathes of the Chinese economy are a legacy of the worst command-and-control period. It’s not an exaggeration to say that we can expect to discover the “official numbers” have absolutely no relationship to reality, because the numbers are compiled from various sources including both free-r quasi-capitalist companies and tottering government-owned (and often People’s Liberation Army-owned) conglomerates which cannot be depended upon to report anything accurately.

An example from this article: “a fall in electricity output of 6% in the year to the fourth quarter, down from average annual growth of 15% over the previous five years.” That’s not just a reduction in the rate of growth, that’s a reported drop in output of 6%. Imagine what the state of a European or Japanese/Korean economy running at only 94% of electricity … it’d be something you’d only see at times of severe economic contraction, not as a sign of a slow-down in growth.

Finally, on May 22, 2009, a final post on the topic at the old blog:

Official Chinese statistics

If you’ve read the blog for a while, you’ll know that I’m pretty skeptical about how believable the official statistics coming from the Chinese government may be. The Economist is somewhat undecided on the matter … sometimes publishing articles that treat the official numbers as legitimate and other times, showing more doubt:

    Part of the recent optimism in world markets rests on the belief that China’s fiscal-stimulus package is boosting its economy and that GDP growth could come close to the government’s target of 8% this year. Some economists, however, suspect that the figures overstate the economy’s true growth rate and that Beijing would report 8% regardless of the truth. Is China cheating?

    Economists have long doubted the credibility of Chinese data and it is widely accepted that GDP growth was overstated during the previous two downturns. In 1998-99, during the Asian financial crisis, China’s GDP grew by an average of 7.7%, according to official figures. However, using alternative measures of activity, such as energy production, air travel and imports, Thomas Rawski of the University of Pittsburgh calculated that the growth rate was at best 2%. Other economists reckon that Mr Rawski was too pessimistic. Arthur Kroeber of Dragonomics, a research firm in Beijing, estimates GDP growth was around 5% in 1998-99, for example. The top chart, plotting the official growth rate against estimates by Dragonomics, clearly suggests that some massaging of the government statistics may have gone on. The biggest adjustment seems to have been made in 1989, the year of political protests in Tiananmen Square. Officially, GDP grew by over 4%; Dragonomics reckons it actually declined by 1.5%.

Of course, The Economist doesn’t want to lose sales in China, so the last paragraph of the article blithely re-assures readers that things are improving and that the official numbers are much harder to fudge now than they used to be. That may well be true (I rather hope it is), but in the same way that you can get much more impressive growth from a very small base, you can become much more honest with your numbers when you’re starting from pure fiction.

[…] Let’s just say that I’m still unconvinced.

After that, my hobby-horse rides can be found by searching for “china economy” (or just click this link) on the current blog, or you can just peruse the China category.

February 23, 2019

How a statistical error became the key argument in the “everyone must turn vegan” movement

Filed under: Economics, Environment, Food, Health, Politics, USA — Tags: , , , — Nicholas @ 05:00

At The Conversation, Frank M. Mitloehner explains how a flawed statistic — comparing numbers derived from non-parallel bases — evolved into one of the most widely quoted arguments for governments forcing people to give up meat in their diet:

As the scale and impacts of climate change become increasingly alarming, meat is a popular target for action. Advocates urge the public to eat less meat to save the environment. Some activists have called for taxing meat to reduce consumption of it.

A key claim underlying these arguments holds that globally, meat production generates more greenhouse gases than the entire transportation sector. However, this claim is demonstrably wrong, as I will show. And its persistence has led to false assumptions about the linkage between meat and climate change.

[…]

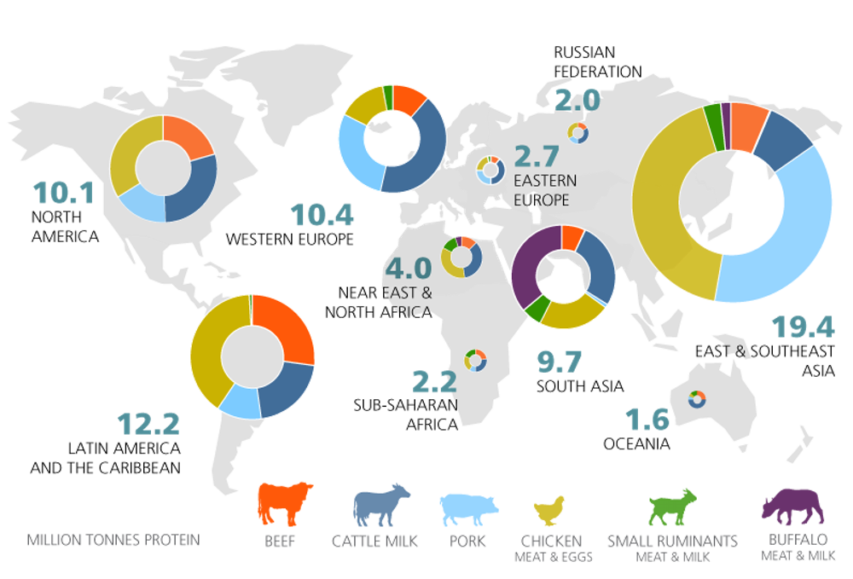
Global livestock production by region (milk and eggs expressed in protein terms).
Source: United Nations Food and Agriculture Organization.

Setting the record straight on meat and greenhouse gases
A healthy portion of meat’s bad rap centers on the assertion that livestock is the largest source of greenhouse gases worldwide. For example, a 2009 analysis published by the Washington, D.C.-based Worldwatch Institute asserted that 51 percent of global GHG emissions come from rearing and processing livestock.

According to the U.S. Environmental Protection Agency, the largest sources of U.S. GHG emissions in 2016 were electricity production (28 percent of total emissions), transportation (28 percent) and industry (22 percent). All of agriculture accounted for a total of 9 percent. All of animal agriculture contributes less than half of this amount, representing 3.9 percent of total U.S. greenhouse gas emissions. That’s very different from claiming livestock represents as much or more than transportation.

Why the misconception? In 2006 the United Nations Food and Agriculture Organization published a study titled “Livestock’s Long Shadow,” which received widespread international attention. It stated that livestock produced a staggering 18 percent of the world’s greenhouse gas emissions. The agency drew a startling conclusion: Livestock was doing more to harm the climate than all modes of transportation combined.

This latter claim was wrong, and has since been corrected by Henning Steinfeld, the report’s senior author. The problem was that FAO analysts used a comprehensive life-cycle assessment to study the climate impact of livestock, but a different method when they analyzed transportation.

For livestock, they considered every factor associated with producing meat. This included emissions from fertilizer production, converting land from forests to pastures, growing feed, and direct emissions from animals (belching and manure) from birth to death.

However, when they looked at transportation’s carbon footprint, they ignored impacts on the climate from manufacturing vehicle materials and parts, assembling vehicles and maintaining roads, bridges and airports. Instead, they only considered the exhaust emitted by finished cars, trucks, trains and planes. As a result, the FAO’s comparison of greenhouse gas emissions from livestock to those from transportation was greatly distorted.

February 19, 2019

Judging a book by its cover (or people by their appearance)

Filed under: Books, History, Science — Tags: , , , , , — Nicholas @ 03:00

In the latest Libertarian Enterprise, Sean Gabb reviews How to Judge People by What They Look Like, by Edward Dutton:

This short book is equally naughty and entertaining. It bounces along, making its points in a light-hearted and generally a witty manner. It is naughty so far as it is a flat challenge to many of the pieties of our age.

We are told never to judge a book by its cover — that the substance of a person, this being character and intelligence, have no measurable relationship to his external form, this being his physical appearance. At the extreme, of looking at correlations between race and intelligence, you can get into serious trouble for disputing this piety. Even moderate dissent earns hostility or just ridicule. Look, for example, at the relevant textbooks. The phlogiston theory is covered as an early theory of combustion, superseded by the truth. Phrenology is denounced as barely short of a moral and intellectual failing. No one thinks ill of Lamarck for this theory of inherited characteristics. Lombroso and his measurement of criminal heads are seen as steps on the road to Auschwitz.

The author of this book takes aim at every one of these pieties. He begins with the easy targets. Within ethnic groups, he goes over the increasingly rehabilitated claim that intelligence is largely inherited — about 80 per cent. He adds the other increasingly rehabilitated claim that there are differences of average intelligence between groups—that the peaks of each distribution curve occur at different points along the scale.

[…]

Now, what follows from all this? The answer is that all truth is important — so far as this is the truth; and I do lack the statistical grounding and the time or inclination to check the author’s scholarship. Even when a particular truth has no practical value, a regard for truth is a generally useful prejudice. But there are certain conclusions that appear to follow.

First, there is has been a progressively greater diversity of external form since the industrial revolution. The stated reason for this is that the harsh conditions of a traditional society, in which about 40 per cent of children died, and the higher classes had more surviving offspring, created a strong bias towards the survival of the intelligent and conscientious. Since then, the fall of infant mortality towards zero has thrown this process into reverse. That may explain the growing fall in genius or just high intellectual quality as a fraction of modern populations. It may also explain the decay — and the author says nothing of this — of free institutions, and their replacement by less complex and more maternal forms of government. Old England was free because its people were capable of being free. Modern England is unfree because the people have changed.

February 18, 2019

Mis-measuring inequality

Filed under: Britain, Economics, Government — Tags: , , , , — Nicholas @ 03:00

Tim Worstall explains why any protest in a western country about “inequality” is probably bogus from the get-go:

Their opening line, their justification:

    We live in an age of astonishing inequality.

No, we don’t. We live in an age of astonishing and increasing equality. Thus any set of policies, any series of analysis, that flows from this misunderstanding of reality is going to be wrong.

And that’s all we really need to know about it all.

The problem is that their measurements – the ones they’re paying attention to – of inequality just aren’t the useful ones, the ones we’re interested in. They’re usually pre-tax, pre-benefits. They’re always pre-government supplied services. And they never, ever, look at the thing we’re actually interested in, inequality of living standards.

To give an example, the Trades Union Congress did a calculation a few years back looking at top 10% households in the UK and bottom 10%. They took the average of each decile – so, the average of the top 10% households, the average of the bottom. Then they looked at the ratio between them.

The top 10% gain some 12 times the market income of the bottom 10%. Now take account of taxes and benefits. Then add in the effects of the NHS, free education for all children and so on. Government services. We end up with a ratio of 4 to 1. Life as it’s actually lived gives the top 10% four times the final income – income being defined by consumption of course – of the bottom 10%.

That’s not a high level of inequality.

January 1, 2019

Blog traffic in 2018

Filed under: Administrivia, Media — Tags: , , — Nicholas @ 03:00

As I try to remember to do every New Year, here’s a snapshot of the blog statistics gathered for me by the CyStats WordPress plug-in from 1 January to mid-morning 31 December (click to embiggenate):

As you can tell if you compare this to last year, CyStats have updated their UI so that relevant bits aren’t quite as easy to screencap.

Overall, the numbers are down a bit from 2017, but I still feel it’s worthwhile to carry on…

December 30, 2018

The Long-Run Aggregate Supply Curve

Filed under: Economics — Tags: , , — Nicholas @ 02:00

Marginal Revolution University
Published on 25 Apr 2017

The long-run aggregate supply curve is actually pretty simple: it’s a vertical line showing an economy’s potential growth rates. Combining the long-run aggregate supply curve with the aggregate demand curve can help us understand business fluctuations.

For example, while the U.S. economy grows at about 3% per year on average, it does tend to fluctuate quite a bit. What causes these fluctuations? One cause is “real shocks” that affect the fundamental factors of production. Droughts, changes to the oil supply, hurricanes, wars, technological changes, etc. can all have big and potentially far-reaching consequences.

Next week, we’ll dig into why wages are considered “sticky,” or slow to change.

December 3, 2018

US immigration – two views

Filed under: History, Politics, USA — Tags: , — Nicholas @ 03:00

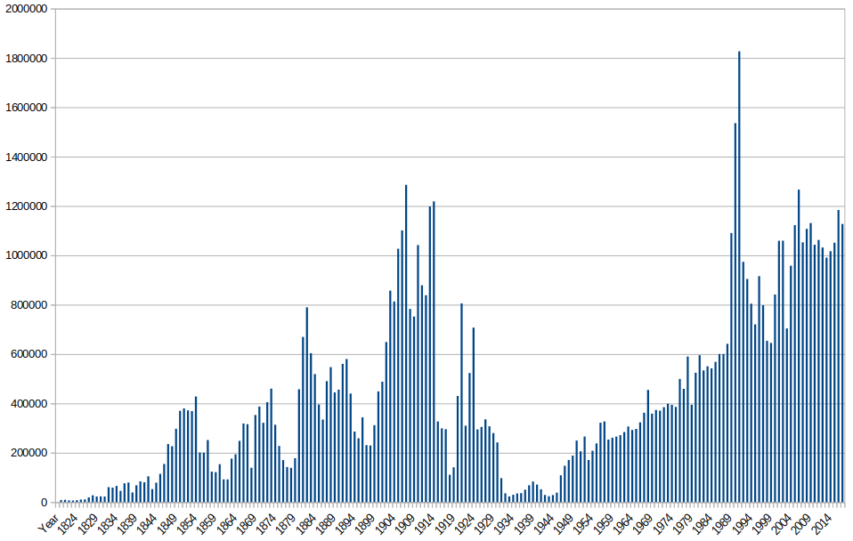
In the latest Libertarian Enterprise, John Walker presents two fascinating charts illustrating the levels of immigration to the United States since the beginning of the nineteenth century. Depending on which one you see, your interpretation will likely differ substantially. The first, the way the statistics are usually presented, show the current rate of immigration to be a very significant — even unprecedented — economic and political concern:

Immigration shown in raw numbers.

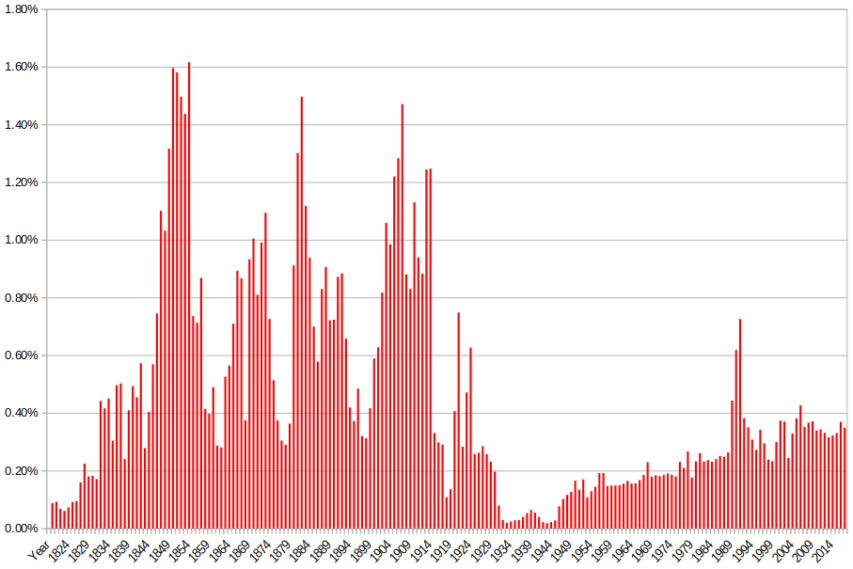
The less common way of illustrating the immigration numbers is showing it proportional to the whole population, which would not work anywhere near as well to support certain narratives:

Immigration to the US shown in proportion to the population.

This is a very different picture. There are clearly two different epochs. In the first, between 1820 and 1930, the U.S. was “filling up the empty country” by admitting large numbers of immigrants. Then, due to immigration restrictions in the Immigration Act of 1924 and the subsequent economic depression and war, immigration remained at low levels until 1946 when, in the immediate postwar period, it jumped. In this view, the impact of the Immigration and Nationality Act of 1965 was not the discontinuous change some present it as (at least in terms of absolute numbers; it may have changed the composition of the immigrant population, which is not captured in these statistics).

Instead, the trend established after 1946 continued to rise continuously until 1989–1991 when it went all whacko. These numbers, as a fraction of the population, haven’t been seen 1923 or since. If you take out those crazy years, the overall trend of immigration as a fraction of the existing population continues to rise almost linearly since 1946.

November 26, 2018

You can make a strong case that “nutrition science is not just misguided but actually harmful”

Filed under: Food, Health, Media, Science, USA — Tags: , — Nicholas @ 03:00

Alex Berezow outlines the ferment and upheaval in modern nutrition science reporting:

One day, coffee causes cancer; the next, it cures cancer. One day, wine is good for you; the next it kills you. Given its self-contradictory wishy-washiness, can nutrition science be trusted?

Not at all, say Edward Archer and his co-authors, in a new paper published in Frontiers in Nutrition. They believe nutrition research is so bad that they call our current scientific discourse on the relationship between diet and disease to be “fictional.”

This isn’t the first time that Dr. Archer lobbed a grenade into the field of nutrition. In an article for RealClearScience, he (in)famously called the U.S. dietary guidelines a “scientific fraud” based on “implausible” data that “create[s] fear and uncertainty in American citizens.”

Clearly, Dr. Archer believes that nutrition science is not just misguided but actually harmful. That’s an extraordinary statement that requires extraordinary evidence.

Any nutrition study that’s based on self-reporting depends on the participants to be honest and fully revealing of their food and drink intake. At a time when we’re food-shamed on a daily basis by the government and the media for our “failings”. Even mostly honest reporters are likely to ever-so-slightly under-report their intake of whatever foods are the subject of this week’s “two-minute hate”. One of my favourite examples of blatant under-reporting is that — if you believe the reports — approximately half of all the booze sold in Britain is just poured down the drain:

The only real pitfall in this kind of research is the problem of people under-reporting how much they drink. The amount of alcohol sold in the UK is about twice the amount that people claim to drink, so unless we throw away a huge amount of booze, it is certain that people either forget about how much they drink or they deliberately lie to researchers. In either case, we can assume that the people who say they consume two drinks a day are probably consuming three or four drinks, in which case the amount that you have to drink to assume the same level of risk as a non-drinker is even more than this graph suggests.

H/T to Blazing Cat Fur for the link.

November 21, 2018

Statistics Canada’s instrumentalist philosophy

Filed under: Cancon, Government, Liberty, Politics — Tags: , , , — Nicholas @ 03:00

In the Financial Post, Bruce Pardy discusses the motivation behind Statistics Canada’s recently revealed demand for the private financial records of half a million Canadians:

Recently it was revealed that Statistics Canada sought to obtain the private banking information of half a million Canadians without their knowledge or consent. Jennifer Robson, professor of political management at Carleton University, in an interview with the CBC, justified the data sweep on the grounds that governments need this information to make good policy. But don’t be concerned, she said, it is not for ideological purposes, since Statistics Canada is ideologically neutral. That made me laugh. The very idea of policy based on data reflects an instrumentalist belief that governments should solve social problems by political means. That requires an ideological confidence in the administrative state, to which the agency is a handmaiden.

Ideology is not a dirty word. An ideology is merely a worldview, a lens through which to perceive society. Political parties, by definition, each have one (and sometimes extra ones for special occasions). But it is another thing for a public agency to act independently in furtherance of its own ideology while pretending to be neutral.

Statistics Canada’s deep dive into banking records — presently on hold while federal privacy commissioner Daniel Therrien investigates its legality — appears not to have been directed by government officials but was undertaken on its own initiative. The agency’s decision is consistent with a conviction that the more personal data available to government, the better off we will be; that governments are benevolent; that private financial matters call for public policy management; and that a bigger government is a better government. A commitment to social policy, wrote Milton Friedman “involves the acceptance of the socialist view that political mechanisms, not market mechanisms, are the appropriate way to determine the allocation of scare resources to alternative uses.”

November 16, 2018

QotD: Defining hate speech

Then, of course, there is the question of where hate-speech ends and legitimate commentary starts. It is generally easy to recognise the vilest abuse that is intended only to inflame and not to argue, just as it is easy to recognise pure pornography (I use the word ‘pure’ in its chemical, not its moral sense, of course). But often matters are much more complex than this.

For example, I recently saw the following statistic in a serious article on the internet: that Nigerian immigrants to Switzerland are seven times as likely to be convicted for a crime as Swiss citizens. Surely no one who wrote such a thing could think that it was calculated to create warm feelings in the hearts of the Swiss towards Nigerian immigrants, except those very few of Fabian mentality, who see in serial killers a cry for help (from the killers, of course, not from their victims).

The statistic – let us assume – is true. But then let us ask whether it has been corrected for the different sex and age structures of the two populations, that of the Nigerian immigrants and that of the Swiss population.

If it has not (and the article does not say), it is easily conceivable that a better, or at least different, statistic would be that Nigerian immigrants are only twice or three times as likely to be convicted for a crime as Swiss citizens. And if this were in fact the case, would the man who published the article be guilty of hate-speech, or merely of intellectual error? Is the test of hate-speech to be whether something does in fact bring a group into hatred, ridicule and contempt, or whether it is intended to do so?

It is easy to multiply examples. In this country, young Moslem men far out-fill their quota in prison, while young Hindu and Sikh far underperform where criminal conviction is concerned. Is this an interesting and important sociological fact, or an incitement to hatred, ridicule and contempt, or perhaps both?

A further problem is that of judging how sensitive people actually are or should be to perceived slights and insults. Just as the expression of hatred can be self-reinforcing, so can the sensitivity to slight and injury. The more you are protected from it, the more of it you perceive, until you end up being a psychological egg-shell. The demand for protection becomes self-reinforcing, until a state is reached in which nobody says what he means, and everybody infers what is not meant. Temperatures, or tempers, are raised, not lowered. The disgracefully pusillanimous (and incompetent) Macpherson report into the killing of Stephen Lawrence demonstrated the risks we run: it suggested that a racial incident should be defined as an incident which any witness to it believed to be racial, without there being any need for objective evidence that it was. Where a British judge can be so pusillanimously unattached to the rule of law, we can be sure that one day hate-speech will be defined as any speech that anyone finds hateful.

Theodore Dalrymple, “Hating the Truth”, Salisbury Review, 2011-06.

« Newer PostsOlder Posts »

Powered by WordPress