
In the latest Libertarian Enterprise, John Walker presents two fascinating charts illustrating the levels of immigration to the United States since the beginning of the nineteenth century. Depending on which one you see, your interpretation will likely differ substantially. The first, the way the statistics are usually presented, show the current rate of immigration to be a very significant — even unprecedented — economic and political concern:
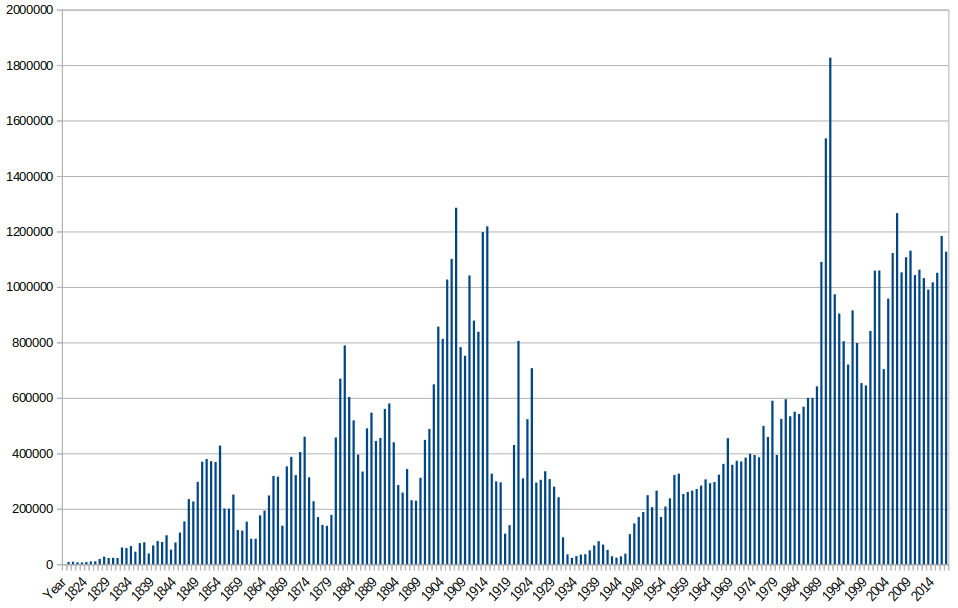
Immigration shown in raw numbers.
The less common way of illustrating the immigration numbers is showing it proportional to the whole population, which would not work anywhere near as well to support certain narratives:
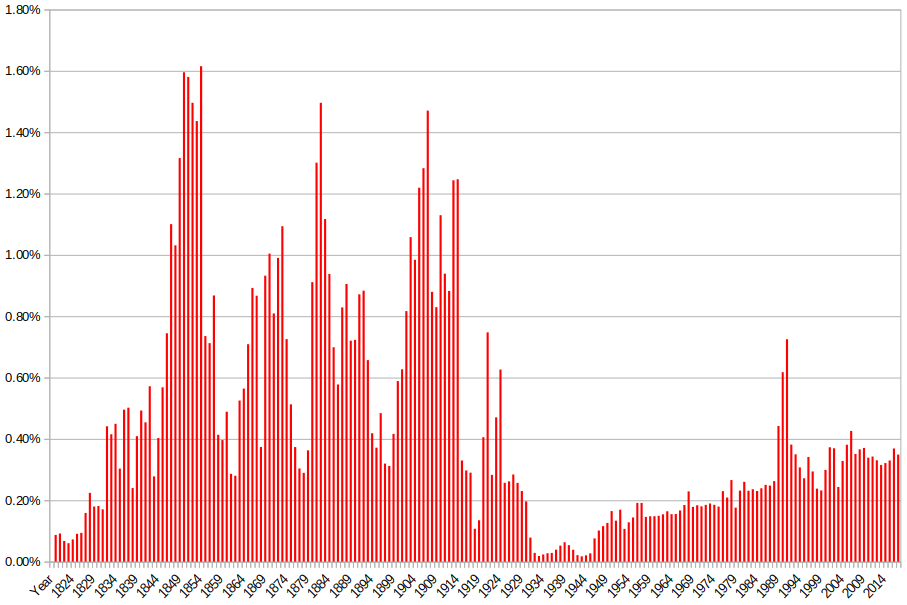
Immigration to the US shown in proportion to the population.
This is a very different picture. There are clearly two different epochs. In the first, between 1820 and 1930, the U.S. was “filling up the empty country” by admitting large numbers of immigrants. Then, due to immigration restrictions in the Immigration Act of 1924 and the subsequent economic depression and war, immigration remained at low levels until 1946 when, in the immediate postwar period, it jumped. In this view, the impact of the Immigration and Nationality Act of 1965 was not the discontinuous change some present it as (at least in terms of absolute numbers; it may have changed the composition of the immigrant population, which is not captured in these statistics).
Instead, the trend established after 1946 continued to rise continuously until 1989–1991 when it went all whacko. These numbers, as a fraction of the population, haven’t been seen 1923 or since. If you take out those crazy years, the overall trend of immigration as a fraction of the existing population continues to rise almost linearly since 1946.


