Quotulatiousness

January 30, 2013

American fourth quarter GDP down 0.1%

Filed under: Economics, Military, USA — Tags: , , — Nicholas @ 10:29

The optimistic folks at Business Insider assure us that the unexpectedly bad number for the US fourth quarter hides some good news:

People will be stunned to see that today’s GDP report went negative for Q4… the first negative print since The Great Recession.

But the report isn’t that bad. In fact it was arguably good.

For one thing, most of the collapse was due to a stunning fall in military spending. That’s not good for GDP, but it doesn’t reflect the real underlying strength of the economy.

And it’s mostly due to war drawdown. That’s a good thing for everyone!

January 3, 2013

Better late than never, the annual stats post

Filed under: Media — Tags: , — Nicholas @ 14:09

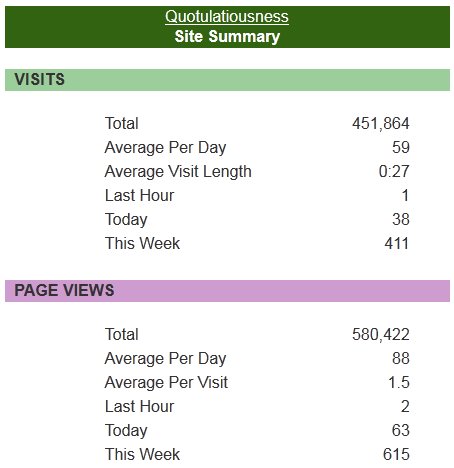
Despite seeing lots of folks posting their annual traffic counts over the last few days, I forgot to even look at the Quotulatiousness stats page until just now. On the numbers, I think it’s safe to say that the blog continues to grow (but don’t ask me why):

Quotulatiousness visits 2009-2012

Quotulatiousness hits 2009-2012

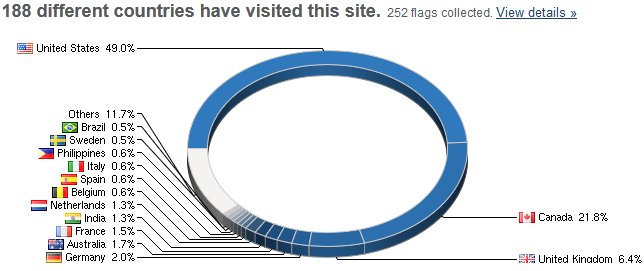
Those are the internal WordPress numbers, starting from 10 July, 2009 when I switched over from the original site. Notional nationality breakdown, courtesy of Flag Counter:

Quotulatiousness Flag Counter 20130103

Generally speaking, every other visitor to the blog is American, one in five is Canadian, one in 20 is British, and the rest of the world combines for the remaining quarter. No wonder I have so many stories with American angles…

The old site still gets some traffic, but you’ll notice that the total traffic there (including from sometime in the late summer of 2004 down to today) doesn’t add up to a particularly large number:

Quotulatiousness old site stats 2004-2013

January 2, 2013

Don’t let your BMI scare you (too much)

Filed under: Health, Media — Tags: , , , , — Nicholas @ 10:47

A quick reminder that the Body Mass Index (BMI) is more a convenient mathematical trick than an actual healthy weight guideline:

In a finding that could undermine many New Year’s resolutions, a new government study shows that people who are overweight are less likely to die in any given period than people of normal weight. Even those who are moderately obese don’t have a higher-than-normal risk of dying.

Being substantially obese, based on measure called body mass index, or BMI, of 35 and higher, does raise the risk of death by 29%, researchers found.

But people with a BMI of 25 to 30 — who are considered overweight and make up more than 30% of the U.S. population — have a 6% lower risk of death than people whose BMI is in the normal range of 18.5 to 25, according to the study, being published Wednesday in the Journal of the American Medical Association.

People who had a BMI of 30 to 35 — considered the first stage of obesity — had a 5% lower risk of dying, but those figures weren’t considered statistically significant.

In other words, a few extra pounds are not going to threaten your life (a lot of extra pounds might). In the western world, few of us have the kind of jobs that require much in the way of physical exertion and we also have both relatively low food prices and much greater access to calorie-dense food. Our parents tended to have jobs that required more physical effort and their access to food was not as great as ours (they were less wealthy overall, and didn’t eat at restaurants or fast food joints as often as we do). Two otherwise positive trends that combine to produce a less-positive result on the scales.

Earlier discussion of the limitations of BMI as a guideline here, here, here, and here.

December 30, 2012

The Gross National Happiness hoax

Filed under: Asia, Economics, Government, Media — Tags: , , , , , — Nicholas @ 12:14

Remember the brief flicker of media interest in replacing the Gross National Product measurement with something called Gross National Happiness? It didn’t seem to catch on, which is fortunate, because the poster child for GNH is Bhutan:

Mainstream economists and almost all national bureaucracies around the world use measures such as Gross Domestic Product (GDP) or Gross National Product (GNP) to measure and track economic activity. These measurements are evidence-based. Hard data is aggregated and analyzed to come up with a picture of a national economy that is accurate and reliable. Based on such data, sound economic and development policies can be formulated. Not so for the Kingdom of Bhutan — a country ruled with an iron fist by its northern-based Buddhist Drukpa monarchy and elite with a transparent façade of democracy designed to obscure the true state of affairs in that country.

Having engaged in a massive ethnic cleansing campaign against its Lhotsampa minority of Nepalese origin from the mid 1980’s to the early 1990’s, Bhutan’s leadership prefers to use the amorphous and malleable measure of Gross National Happiness (GNH) to claim that their citizens — at least the ones that were not forcibly evicted from the country — are among the “happiest” in the world. Being a wholly subjective measure that utilizes no quantifiable data, GNH has been creatively utilized as a propaganda tool by the Drukpa leadership to project an image of Bhutan as a country of smiling Buddha’s. Little do most outside observers know the dark underbelly of this seemingly innocuous portrayal. It willfully ignores the history of ethnic cleansing and institutionalized racial intolerance against Lhotsampas inside Bhutan that continue unabated to this day.

[. . .]

With its record of ethnic cleansing and intolerance, it is morbidly amusing to hear propaganda that Bhutan is some sort of mythic “last Shangri-La,” a land of harmony and peace. Nothing could be more removed from the truth. The charade of ushering in a constitutional monarchy in the last few years and the ascension of the charismatic 31-year-old Oxford-educated King Jigme Khesar Namgyal Wangchuk has led to a fresh burst of official Bhutanese propaganda expounding the unique nature of their happy people and of Gross National Happiness in general.

December 20, 2012

“Japanese are smart. Chinese are smart. Americans are smart. Even Finns are smart. But Canadians? We tend to be plodders.”

Filed under: Cancon, Economics, USA — Tags: , , — Nicholas @ 12:38

William Watson on a terrible psychological burden Canada has been labouring under for generations — the productivity gap — which does not actually appear to exist.

The good news just keeps pouring in. Last week we learned courtesy of a special report from TD Economics that median income in Canada had caught up with median income in the U.S. Never mind that the measure of income used was a little screwy: market income plus cash received from the government — basically all the goodies — with no accounting for taxes paid to the government. Most Canadians seemed tickled by the result anyway, as we always are when outperforming the Americans.

Now this week, just in time for Christmas, comes news that Canada’s productivity, far from having flatlined over the last 30 years, has actually been growing at a perfectly respectable pace that’s even comparable to American rates. It turns out we’re not nearly as incompetent as our official productivity numbers have been suggesting we are. We’ve just been calculating them wrong. In fact, it’s tempting to say our incompetence is mainly in the productivity section of Statistics Canada. Tempting maybe, but not fair. It’s Christmas, after all, and, besides, calculating productivity is like doing Sudoku for a living and there’s plenty of room for disagreement over what the data are saying.

[. . .]

StatCan’s estimates of our MFP have consistently suggested that as a people we aren’t at all clever. We may be lumberjacks. We may be OK. But doing more with less — or even more with the same — just hasn’t been our game. Japanese are smart. Chinese are smart. Americans are smart. Even Finns are smart. But Canadians? We tend to be plodders. Thus over the last half-century our business-sector MFP growth has averaged just 0.28% per year. By contrast, the Americans are used to rates a full percentage point higher. In 2010, they hit 3.4%! But now Diewert and Yu estimate that in fact over the last 50 years our MFP growth has averaged a perfectly respectable 1.03% per year. If you can add 1% a year to overall output without adding more and smarter people and machines to the mix — which of course you’re also allowed to do and we have been doing — your living standards will rise very nicely over time.

How can StatCan’s estimates have been so wrong? Diewert and Yu use quite different techniques at different stages of the calculation, but the main problem surrounds capital services. StatCan’s estimates of how much capital we use in production typically are much higher than Diewert and Yu’s. Partly the difference revolves around abstruse discussions about what internal rates of return to assume when trying to measure capital.

December 17, 2012

QotD: Argentina’s little white interest rate lie

Filed under: Americas, Economics, Quotations — Tags: , , , , , — Nicholas @ 09:49

No one gives a toss that Argentina is lying about its inflation rate. Well, except maybe the economists they’ve fined and ruined for calculating the real one. We’ve all put up with Cuba lying about everything for 60 years after all.

Except, except … Argentina has issued index linked bonds as part of the 2001/2 debt restructuring. The interest paid depends on what the inflation rate is. If the government deliberately undercounts inflation then they get away with rooking the holders of those bonds.

That’s what this is about. That’s why anyone cares. It’s not simply that they’re liars it’s that they’re thieves.

Tim Worstall, “I wish people would get it right about Argentina”, Tim Worstall, 2012-12-17

November 29, 2012

“One economist [said] that his colleagues’ pursuit of happiness was depressing him”

Filed under: Books, Economics, Media — Tags: , , , , — Nicholas @ 09:01

If you read newspapers or magazines, you’ll have noticed a spike in the economics of happiness over the last few years. Everyone seems to be reporting results of happiness surveys from all over … few of whom seem to agree on how to measure it or in some cases even what it is that they’re trying to measure. Claude Fischer talks about this recent boom market:

Bhutan’s Gross National Happiness Commission uses citizens’ reports of their happiness to assess national progress, and former French President Nicholas Sarkozy appointed a Nobel-encrusted commission to study a similar idea; the United Nations places “happiness indicators” on its war-burdened agenda; American science institutions pour money into fine-tuning measurements of “subjective well-being”; and Amazon’s list of happiness books by moonlighting professors runs from The Happiness Hypothesis to Stumbling on Happiness, Authentic Happiness, Engineering Happiness, and beyond.

Since at least the 1950s, academics have analyzed surveys asking people how happy or satisfied they feel. We’ve used fuzzy questions such as, “Taken all together, how would you say things are these days — would you say that you are very happy, pretty happy, or not too happy?” to assess respondents’ morale. We’ve compared, say, women to men and the poor to the rich. Dutch sociologist Ruut Veenhoven started compiling the findings into his World Database of Happiness back in the 1980s.

So what set off the current frenzy? Economists found happiness.

In the decade after 2000, the number of articles on happiness in major economics journals roughly tripled. One economist told me a couple of years ago that his colleagues’ pursuit of happiness was depressing him. Nonetheless, established leaders and bright new scholars turned to the topic and brought with them the funding, media prestige, and political clout of the profession. That a guild which prides itself on scientific rigor and hardheadedness would embrace such a sappy concept measured in such mushy ways is, well, bemusing. Even Federal Reserve Chief Ben Bernanke drew on the new economics of happiness to find the moral for his 2010 commencement address to University of South Carolina graduates: “I urge you to take this research to heart by making time for friends and family and by being part of and contributing to a larger community.”

November 27, 2012

The missing generation

Filed under: Business, Media — Tags: , , , — Nicholas @ 09:42

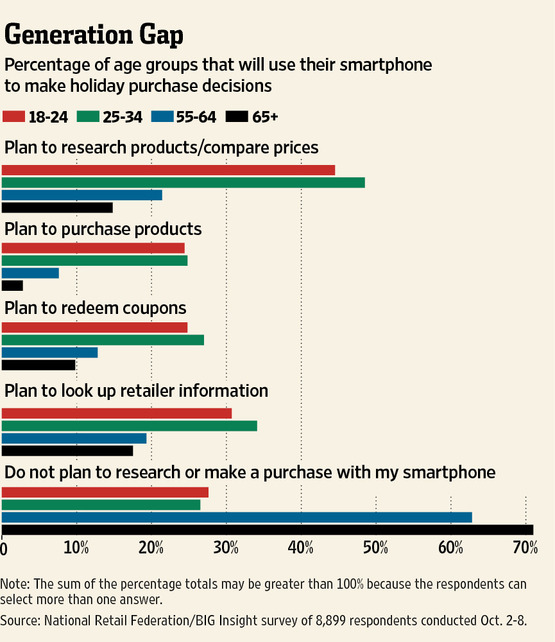
Chris Myrick posted a link to a Wall Street Journal article on differences among the age cohorts regarding shopping habits, pointing out that his (and my) generation didn’t even show up in the graphic:

Hmmm. We can tell the shopping habits of folks from age 18 up to 34, then from 55 upwards. I wonder why the invisible folks aged 35-54 didn’t qualify? Perhaps because their behaviour would ruin the message the article is trying to push?

November 14, 2012

The “manufacturing fetish”

Filed under: Economics, Media, Politics — Tags: , , , , — Nicholas @ 10:54

John Kay talks about the widespread belief that only manufacturing is “real” in terms of what a national economy produces:

Manufacturing fetishism — the idea that manufacturing is the central economic activity and everything else is somehow subordinate — is deeply ingrained in human thinking. The perception that only tangible objects represent real wealth and only physical labour real work was probably formed in the days when economic activity was the constant search for food, fuel and shelter.

A particularly silly expression of manufacturing fetishism can be heard from the many business people who equate wealth creation with private sector production. They applaud the activities of making the pills you pop and processing the popcorn you eat in the interval. The doctors who prescribe the pills, the scientists who establish that the pills work, the actors who draw you to the performance and the writers whose works they bring to life; these are all somehow parasitic on the pill grinders and corn poppers.

When you look at the value chain of manufactured goods we consume today, you quickly appreciate how small a proportion of the value of output is represented by the processes of manufacturing and assembly. Most of what you pay reflects the style of the suit, the design of the iPhone, the precision of the assembly of the aircraft engine, the painstaking pharmaceutical research, the quality assurance that tells you products really are what they claim to be.

Physical labour incorporated in manufactured goods is a cheap commodity in a globalised world. But the skills and capabilities that turn that labour into products of extraordinary complexity and sophistication are not. The iPhone is a manufactured product, but its value to the user is as a crystallisation of services.

[. . .]

Most unskilled jobs in developed countries are necessarily in personal services. Workers in China can assemble your iPhone but they cannot serve you lunch, collect your refuse or bathe your grandmother. Anyone who thinks these are not “real jobs” does not understand the labour they involve. There is a subtle gender issue here: work that has historically mostly been undertaken by women at home — like care and cooking — struggles to be regarded as “real work”.

November 6, 2012

China’s economic statistics

Filed under: China, Economics — Tags: , — Nicholas @ 11:52

If you’ve been following the blog for a while, you’ll know that I’ve been rather skeptical about the official statistics reported by Chinese government and media sources. I’ve been rather more skeptical about western media outlets that depend on these statistics as if they were issued by the US, Canadian, or British governments — China does not have a stable and transparent way of gathering or compiling economic data, but even more to the point they have significant political reasons for using the reported statistics for political reasons.

In Forbes, Tim Worstall looks at retail car sales in China’s luxury market for a recent example:

For China is a large enough place, and different enough, that you can spin the same statistics any way that you want to. For example, take a couple from today’s new about car sales in the country. Apparently you can now buy the top of the line Bentley on same day service, no wait for delivery […]

The jump in sales was 30% for China. So are car sales slowing down? Or not? Is BMW’s stonkingly good quarter just because they have been filling the dealers’ lots? Is Bentley’s bad one because they did that last quarter? Are BMW counting deliveries to dealers, as the official statistics do, or are they counting true sales?

This is one of the problems with looking at Chinese economic statistics. The place doesn’t necessarily compile all the numbers the same way we do: nor does it necessarily compile them in a consistent manner across the country.

Encouraging and exhorting didn’t work, so now they’re trying to shame you into voting

Filed under: Politics, USA — Tags: , — Nicholas @ 09:54

At Techdirt, Mike Masnick reports on the latest attempt to get out the vote:

It’s election day. While your actual ballot is (supposed to be) secret, a lot of people don’t know that whether or not you voted at all is public information. A few weeks back, On the Media covered some ways that campaigns try to get out the vote and looked at some research suggesting that letters to people with a “voter report card” showing when they’ve voted in the past was a somewhat effective way of shaming people into voting. An even more extreme example was given as well: a letter that specifically shows how often your neighbors have voted. In the piece, OTM producer Chris Neary noted that while such things were effective in the lab, people shouldn’t be expecting such letters for real, because, while they may be effective in getting out the vote, they also freak people out on privacy grounds, and no campaign wants to risk freaking people out:

    And, by the way Brooke, you’ll never get that last letter. Campaigns hate to send out anything that prompts virulent hate mail in return, and one of those researchers got some of that mail.

Except… Neary has now posted an apology blog post after some OTM listeners reached out to share exactly the kinds of mailers discussed. While campaigns might shy away from such tactics, apparently third party organizations read the exact same research and took it to heart — as they’re a lot less worried about hate mail

All of the various political parties, pressure groups, “public interest” organizations and the rest are desperate to ramp up voter participation in the election. It’s frequenly pointed out that voters are apathetic and the reduced percentage of voters over the last thirty-plus years is trotted out as evidence of that. However, as Katherine Mangu-Ward points out in this month’s issue of Reason, for the vast majority of Americans Your Vote Doesn’t Count:

Let’s start with the basics: Your vote will almost certainly not determine the outcome of any public election. I’m not talking about conspiracy theories regarding rigged elections or malfunctioning voting machines — although both of those things have happened and will happen again. I’m not talking about swing states or Supreme Court power grabs or the weirdness of the Electoral College. I’m talking about pure, raw math.

In all of American history, a single vote has never determined the outcome of a presidential election. And there are precious few examples of any other elections decided by a single vote. A 2001 National Bureau of Economic Research paper by economists Casey Mulligan and Charles Hunter looked at 56,613 contested congressional and state legislative races dating back to 1898. Of the 40,000 state legislative elections they examined, encompassing about 1 billion votes cast, only seven were decided by a single vote (two were tied). A 1910 Buffalo contest was the lone single-vote victory in a century’s worth of congressional races. In four of the 10 ultra-close campaigns flagged in the paper, further research by the authors turned up evidence that subsequent recounts unearthed margins larger than the official record initially suggested.

The numbers just get more ridiculous from there. In a 2012 Economic Inquiry article, Columbia University political scientist Andrew Gelman, statistician Nate Silver, and University of California, Berkeley, economist Aaron Edlin use poll results from the 2008 election cycle to calculate that the chance of a randomly selected vote determining the outcome of a presidential election is about one in 60 million. In a couple of key states, the chance that a random vote will be decisive creeps closer to one in 10 million, which drags voters into the dubious company of people gunning for the Mega-Lotto jackpot. The authors optimistically suggest that even with those terrible odds, you may still choose to vote because “the payoff is the chance to change national policy and improve (one hopes) the lives of hundreds of millions, compared to the alternative if the other candidate were to win.” But how big does that payoff have to be to make voting worthwhile?

October 29, 2012

US 3rd quarter GDP number less substantial than it appears

Filed under: Economics, Media, USA — Tags: — Nicholas @ 11:17

A bit of a downer for what would otherwise be good economic news:

Chart from the Mercatus Center at George Mason University.

Polls are less accurate thanks to a 9% response rate (and falling)

Filed under: Media, Politics — Tags: , , , — Nicholas @ 10:41

Iowahawk has been posting a daily Twitter update reminding people that the reliability of political polls is much lower than ever before:

At Macleans, Colby Cosh digs a bit deeper to find out how polling organizations are responding to their approaching-flatline response rate:

The boffins are becoming increasingly reliant on “non-probability samples” like internet panel groups, which give only narrow pictures of biased subsets of the overall population. The good news is that they can take many such pictures and use modern computational techniques to combine them and make pretty decent population inferences. “Obama is at 90 per cent with black voters in Shelbyville; 54 per cent among auto workers; 48 per cent among California epileptics; 62 per cent with people whose surnames start with the letter Z…” Pile up enough subsets of this sort, combined with knowledge of their relative sizes and other characteristics, and you can build models which let you guess at the characteristics of the entire electorate (or, if you’re doing market research, the consumerate).

As a matter of truth in advertising, however, pollsters have concluded that they shouldn’t report the uncertainty of these guesses by using the traditional term “margin of error.” There is an extra layer of inference involved in the new techniques: they offer what one might call a “margin of error, given that the modelling assumptions are correct.” And there’s a philosophical problem, too. The new techniques are founded on what is called a “Bayesian” basis, meaning that sample data must be combined explicitly with a prior state of knowledge to derive both estimates of particular quantities and the uncertainty surrounding them.

[. . .]

Pollsters are trying very hard to appear as transparent and up-front about their methods as they were in the landline era. When it comes to communicating with journalists, who are by and large a gang of rampaging innumerates, I don’t really see much hope for this; polling firms may not want their methods to be some sort of mysterious “black box,” but the nuances of Bayesian multilevel modelling, even to fairly intense stat hobbyists, might as well be buried in about a mile of cognitive concrete. Our best hope is likely to be the advent of meta-analysts like (he said through tightly gritted teeth) Nate Silver, who are watching and evaluating polling agencies according to their past performance. That is, pretty much exactly as if they were “black boxes.” In the meantime, you will want to be on the lookout for that phrase “credibility interval.” As the American Association for Public Opinion Research says, it is, in effect, a “[news] consumer beware” reminder.

Twenty million broken windows

Filed under: Economics, Environment, Media — Tags: , , — Nicholas @ 09:03

At Forbes, Tim Worstall patiently explains that the damage from Hurricane Sandy (or any major storm) will appear to boost GDP, because it only measures money spent to repair damage, not the costs incurred or the opportunities foregone because of the damage:

We know very well that Hurricane (or Frankenstorm as some are calling it) Sandy will leave a trail of destruction across parts of the US today. There will almost certainly be deaths, as there have been in the hurricane’s passage across the Caribbean. And there will also be a boost to the US economy. Which is really evidence of quite how wrong we are in the way that we measure the economy.

[. . .]

The problem with this is that it is only true because of the way that we calculate GDP. In our working of the numbers we assume that it’s final consumption at market prices: that is, the value that consumers put on everything. However, this is not true of government spending. It’s very difficult indeed to work out what government spending is actually worth: for as we’ve not a choice in it then there’s no market price nor accurate valuation from the people who actually get whatever is produced. Some government spending is most certainly worth more than the actual amount spent. The court system say: a pre-requisite of our having a complex society at all. Other parts not so much: what is the true value of a diversity adviser for example? So what we actually do is value all government spending, for GDP purposes, at the cost of that actual spending. Government spends $100, GDP goes up by $100. That’s just how we define it. This can cause amusement in measuring the success of welfare programs for example. Even Census admits that some of the people who receive Medicaid, or food stamps, value what they receive at less than the cost of providing it.

[. . .]

Now imagine that Hurricane Sandy does $10 billion of damage to that wealth (for our purposes it doesn’t matter whether it’s $100 billion or $1 trillion. Although this obviously matters to everyone except for the purposes of this example). The US is now worth $99.990 Trillion. GDP might rise to $15.1 trillion as we repair that damage. But we’re not in fact any richer at all: despite the fact that GDP has gone up. What has actually happened is that some of our stock of wealth has been destroyed and we’re having to do more work in order to rebuild it. This is exactly the same as our pollution example. We’re measuring what we produce but not the capital stock of what we have (or had).

Yes, the rebound from Sandy may well provide a boost to the economy. But that’s a function of the way that we measure that economy, not a real boost in our general wealth.

October 13, 2012

Sometimes there’s a logical reason to discriminate in pricing

Filed under: Business, Europe — Tags: , , , — Nicholas @ 11:00

Tim Harford on the recent EU ruling that insurers will no longer be allowed to consider gender in setting insurance rates:

He: And not before time. It’s outrageous that I have to pay more for my car insurance than you do. I’m a perfectly safe driver.
She: Of course you are, dear. But you also drive a lot more than I do, which is not unusual for men. Since you drive more miles you are exposing yourself to the risk of more accidents.
He: Am I? Oh.
She: This is one of the reasons that men have more accidents than women. Another, of course, is that some young men are aggressive, overconfident idiots. But in any case you should probably put the money you save into your pension pot because you’re going to need it when you get stuck with the low annuity rates we women have had to put up with.
He: But my life expectancy is shorter. I deserve much higher annuity rates. That’s outrageous.
She: So you’re outraged that discrimination against you hasn’t ended earlier, and equally outraged that discrimination in your favour isn’t going to continue for ever?

[. . .]

She: We might not get too comfortable. Insurers will start looking at other correlates of risk. The obvious one is how far people drive: men tend to drive more than women. Then there are issues such as the choice of a sports car rather than a people carrier. Such distinctions may carry more weight in determining your premium than they do now. As for annuities, if they can’t pay any attention to your sex they might start paying more attention to your cholesterol.
He: I can see that this might get very intrusive.
She: It might. Or it might get very clumsy. Mortgage lenders used to be accused of using geography as a way of discriminating against minorities in the US, since ethnicity and postcode can be closely correlated. There are modern analogies: since women are on average smaller than men, perhaps in the future premiums will be proportionate to height. Stranger things have happened.

« Newer PostsOlder Posts »

Powered by WordPress