Published on 23 Feb 2016
One of the of the practice questions from our “Growth Rates Are Crucial” video asks you to compare real GDP per capita for two countries that start at the same place, but grow at different rates. It’s a little tricky:
Suppose two countries start with the same real GDP per capita, but country A is growing at 2% per year and country B is growing at 3% per year. After 140 years, country B will have a real GDP per capita that is roughly ________ times higher than country A. (Hint- you may want to review the “Rule of 70” to answer this question.)
We asked our Instructional Designer, Mary Clare Peate, to hold virtual “office hours” to guide you through how to solve this problem. Join her as she discusses your questions!
April 17, 2017
Office Hours: Rule of 70
April 13, 2017
QotD: Soviet statistics
Being a correspondent in Moscow, I found, was, in itself, easy enough. The Soviet press was the only source of news; nothing happened or was said until it was reported in the newspapers. So all I had to do was go through the papers, pick out any item that might be interesting to readers of the Guardian, dish it up in a suitable form, get it passed by the censor at the Press Department, and hand it in at the telegraph office for dispatch. One might, if in a conscientious mood, embellish the item a little … sow in a little local colour, blow it up a little, or render it down a little according to the exigencies of the new situation. The original item itself was almost certainly untrue or grotesquely distorted. One’s own deviations, therefore, seemed to matter little, only amounting to further falsifying what was already false.
This bizarre fantasy was very costly and elaborate and earnestly promoted. Something gets published in Pravda; say, that the Soviet Union has a bumper wheat harvest – so many poods per hectare. There is no means of checking; the Press Department men don’t know, and anyone who does is far, far removed from the attentions of foreign journalists. Soviet statistics have always been almost entirely fanciful, though not the less seriously regarded fro that. When the Germans occupied Kiev in the 1939-45 war they got hold of a master Five Year Plan, showing what had really been produced and where. Needless to say, it was quite different from the published figures. This in no way affected credulity about such figures subsequently, as put out in Russia, or even in China.
Malcolm Muggeridge, Chronicles of Wasted Time, 2006.
April 9, 2017
The Australian demographer’s Christmas
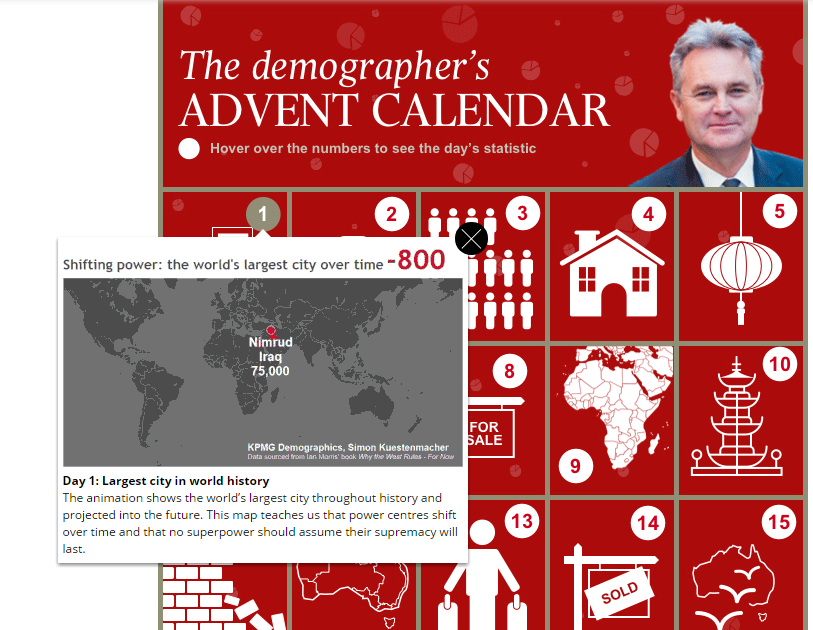
An amusing post at the Weekend Australian … an Advent Calendar for demographic tidbits:
The demographer’s Christmas is the day the ABS releases census results. It happens once every five years and that day, Tuesday 11 April, is fast approaching. Demographers are counting down the days until they can open their data presents. And now you can join in the fun with the demographer’s advent calendar.
Every day until the release we will be featuring a tasty data hors d’oeuvres to get you in the mood for a whole lot of Australian social demography.
H/T to Stephen Gordon for the link.
April 7, 2017
Growth Rates Are Crucial
Published on 12 Jan 2016
In the first video in this section on The Wealth of Nations and Economic Growth, you learned a basic fact of economic wealth — that countries can vary widely in standard of living. Specifically, you learned how variations in real GDP per capita can set countries leagues apart from one another.
Today, we’ll continue on that road of differences, and ask yet another question.
How can we explain wealth disparities between countries?
The answer? Growth rates.
And in this video, you’ll learn all about the ins-and-outs of measuring growth rates.
For one, you’ll learn how to visualize growth properly — examining growth in real GDP per capita on a ratio scale.
Then, here comes the fun part: you’ll also take a dive into the growth of the US economy over time. It’s a little bit like time travel. You’ll transport yourself to different periods in the country’s economic history: 1845, 1880, the Roaring Twenties, and much more.
As you transport yourself to those times, you’ll also see how the economies of other countries stack up in comparison. You’ll see why the Indian economy now is like a trip back to the US of 1880. You’ll see why China today is like the America of the Jazz Age. (You’ll even see why living in Italy today is related to a time when Atari was popular in the US!)
In keeping with our theme, though, we won’t just offer you a trip through ages past.
Because by the end of this video, you’ll also have the answer to one vital question: if the US had grown at an even higher rate, where would we be by now?
The magnitude of the answer will surprise you, we’re sure.
But then, that surprise is in the video. So, go on and watch, and we’ll see you on the other side.
March 20, 2017
Basic Facts of Wealth
Published on 5 Jan 2016
We know that there are rich countries, poor countries, and countries somewhere in between. Economically speaking, Japan isn’t Denmark. Denmark isn’t Madagascar, and Madagascar isn’t Argentina. These countries are all different.
But how different are they?
That question is answered through real GDP per capita—a country’s gross domestic product, divided by its population.
In previous videos, we used real GDP per capita as a quick measure for a country’s standard of living. But real GDP per capita also measures an average citizen’s command over goods and services. It can be a handy benchmark for how much an average person can buy in a year — that is, his or her purchasing power. And across different countries, purchasing power isn’t the same.
Here comes that word again: it’s different.
How different? That’s another question this video will answer.
In this section of Marginal Revolution University’s course on Principles of Macroeconomics, you’ll find out just how staggering the economic differences are for three countries — the Central African Republic, Mexico, and the United States.
You’ll see why variations in real GDP per capita can be 10 times, 50 times, or sometimes a hundred times as different between one country and another. You’ll also learn why the countries we traditionally lump together as rich, or poor, might sometimes be in leagues all their own.
The whole point of this? We can learn a lot about a country’s wealth and standard of living by looking at real GDP per capita.
But before we give too much away, check out this video — the first in our section on The Wealth of Nations and Economic Growth.
March 5, 2017
Splitting GDP
Published on 21 Nov 2015
In the last three videos, you learned the basics of GDP: how to compute it, and how to account for inflation and population increases. You also learned how real GDP per capita is useful as a quick measure for standard of living.
This time round, we’ll get into specifics on how GDP is analyzed and used to study a country’s economy. You’ll learn two approaches for analysis: national spending and factor income.
You’ll see GDP from both sides of the ledger: the spending and the receiving side.
With the national spending approach, you’ll see how gross domestic product is split into three categories: consumption goods bought by the public, investment goods bought by the public, and government purchases.
You’ll also learn how to avoid double counting in GDP calculation, by understanding how government purchases differ from government spending, in terms of GDP.
After that, you’ll learn the other approach for GDP splitting: factor income.
Here, you’ll view GDP as the total sum of employee compensation, rents, interest, and profit. You’ll understand how GDP looks from the other side — from the receiving end of the ledger, instead of the spending end.
Finally, you’ll pay a visit to FRED (the Federal Reserve Economic Data website) again.
FRED will help you understand how GDP and GDI (the name for GDP when you use the factor income approach) are used by economists in times of economic downturn.
So, buckle in again. It’s time to hit the last stop on our GDP journey.
February 27, 2017
Real GDP Per Capita and the Standard of Living
Published on 20 Nov 2015
They say what matters most in life are the things money can’t buy.
So far, we’ve been paying attention to a figure that’s intimately linked to the things money can buy. That figure is GDP, both nominal, and real. But before you write off GDP as strictly a measure of wealth, here’s something to think about.
Increases in real GDP per capita also correlate to improvements in those things money can’t buy.
Health. Happiness. Education.
What this means is, as real GDP per capita rises, a country also tends to get related benefits.
As the figure increases, people’s longevity tends to march upward along with it. Citizens tend to be better educated. Over time, growth in real GDP per capita also correlates to an increase in income for the country’s poorest citizens.
But before you think of GDP per capita as a panacea for measuring human progress, here’s a caveat.
GDP per capita, while useful, is not a perfect measure.
For example: GDP per capita is roughly the same in Nigeria, Pakistan, and Honduras. As such, you might think the three countries have about the same standard of living.
But, a much larger portion of Nigeria’s population lives on less than $2/day than the other two countries.
This isn’t a question of income, but of income distribution — a matter GDP per capita can’t fully address.
In a way, real GDP per capita is like a thermometer reading — it gives a quick look at temperature, but it doesn’t tell us everything.It’s far from the end-all, be-all of measuring our state of well-being. Still, it’s worth understanding how GDP per capita correlates to many of the other things we care about: our health, our happiness, and our education.
So join us in this video, as we work to understand how GDP per capita helps us measure a country’s standard of living. As we said: it’s not a perfect measure, but it is a useful one.
February 19, 2017
Nominal vs. Real GDP
Published on 19 Nov 2015
“Are you better off today than you were 4 years ago? What about 40 years ago?”
These sorts of questions invite a different kind of query: what exactly do we mean, when we say “better off?” And more importantly, how do we know if we’re better off or not?
To those questions, there’s one figure that can shed at least a partial light: real GDP.
In the previous video, you learned about how to compute GDP. But what you learned to compute was a very particular kind: the nominal GDP, which isn’t adjusted for inflation, and doesn’t account for increases in the population.
A lack of these controls produces a kind of mirage.
For example, compare the US nominal GDP in 1950. It was roughly $320 billion. Pretty good, right? Now compare that with 2015’s nominal GDP: over $17 trillion.
That’s 55 times bigger than in 1950!
But wait. Prices have also increased since 1950. A loaf of bread, which used to cost a dime, now costs a couple dollars. Think back to how GDP is computed. Do you see how price increases impact GDP?
When prices go up, nominal GDP might go up, even if there hasn’t been any real growth in the production of goods and services. Not to mention, the US population has also increased since 1950.
As we said before: without proper controls in place, even if you know how to compute for nominal GDP, all you get is a mirage.
So, how do you calculate real GDP? That’s what you’ll learn today.
In this video, we’ll walk you through the factors that go into the computation of real GDP.
We’ll show you how to distinguish between nominal GDP, which can balloon via rising prices, and real GDP—a figure built on the production of either more goods and services, or more valuable kinds of them. This way, you’ll learn to distinguish between inflation-driven GDP, and improvement-driven GDP.
Oh, and we’ll also show you a handy little tool named FRED — the Federal Reserve Economic Data website.
FRED will help you study how real GDP has changed over the years. It’ll show you what it looks like during healthy times, and during recessions. FRED will help you answer the question, “If prices hadn’t changed, how much would GDP truly have increased?”
FRED will also show you how to account for population, by helping you compute a key figure: real GDP per capita. Once you learn all this, not only will you see past the the nominal GDP-mirage, but you’ll also get an idea of how to answer our central question:
“Are we better off than we were all those years ago?”
February 6, 2017
January 29, 2017
QotD: Perverse incentives for journalists
Unfortunately, the incentives of both academic journals and the media mean that dubious research often gets more widely known than more carefully done studies, precisely because the shoddy statistics and wild outliers suggest something new and interesting about the world. If I tell you that more than half of all bankruptcies are caused by medical problems, you will be alarmed and wish to know more. If I show you more carefully done research suggesting that it is a real but comparatively modest problem, you will just be wondering what time Game of Thrones is on.
Megan McArdle, “The Myth of the Medical Bankruptcy”, Bloomberg View, 2017-01-17.
January 16, 2017
Why do millennials earn some 20% less than boomers did at the same stage of life?
Tim Worstall explains why we shouldn’t be up in arms about the reported shortfall in millennial earnings compared to their parents’ generation at the same stage:
Part of the explanation here is that the millennials are better educated. We could take that to be some dig at what the snowflakes are learning in college these days but that’s not quite what I mean. Rather, they’re measuring the incomes of millennials in their late 20s. The four year college completion or graduation rate has gone up by some 50% since the boomers were similarly measured. Thus, among the boomers at that age there would be more people with a decade of work experience under their belt and fewer people in just the first few years of a professional career.
And here’s one of the things we know about blue collar and professional wages. Yes, the lifetime income as a professional is likely higher (that college wage premium and all that) but blue collar wages actually start out better and then don’t rise so much. Thus if we measure a society at the late 20s age and a society which has moved to a more professional wage structure we might well find just this result. The professionals making less at that age, but not over lifetimes, than the blue collar ones.
[…]
We’ve also got a wealth effect being demonstrated here. The millennials have lower net wealth than the boomers. Part of that is just happenstance of course. We’ve just had the mother of all recessions and housing wealth was the hardest hit part of it. And thus, given that housing equity is the major component of household wealth until the pension is fully topped up late in life, that wealth is obviously going to take a hit in the aftermath. There is another effect too, student debt. This is net wealth we’re talking about so if more of the generation is going to college more of the generation will have that negative wealth in the form of student debt. And don’t forget, it’s entirely possible to have negative net wealth here. For we don’t count the degree as having a wealth value but we do count the loans to pay for it as negative wealth.
January 1, 2017
Blog traffic in 2016
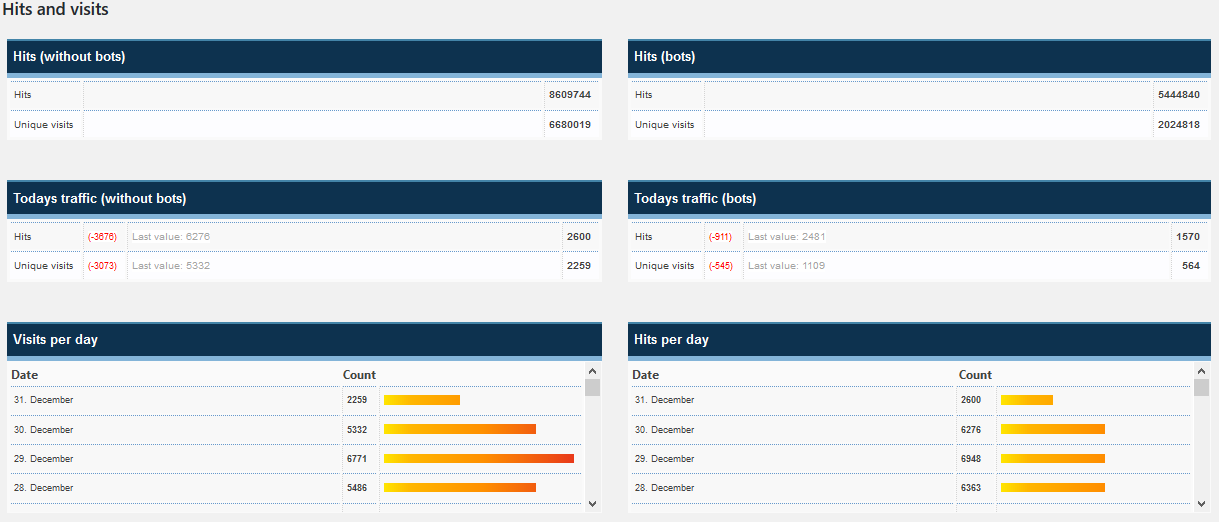
The annual statistics update on traffic to Quotulatiousness from January 1st through December 31st, 2016. Overall, the traffic dropped slightly from 2015, which in turn was down a bit from the peak traffic year of 2014:


Over eight and a half million hits. That’s a pretty good number for an obscure Canadian blog.


The final count of visitors to the blog will be about 2,500-3,500 higher, as I did the screen captures at around 10:30 in the morning.
October 31, 2016
Is the “Gold Standard” of peer review actually just Fool’s Gold?
Donna Laframboise points out that it’s difficult to govern based on scientific evidence if that evidence isn’t true:
We’re continually assured that government policies are grounded in evidence, whether it’s an anti-bullying programme in Finland, an alcohol awareness initiative in Texas or climate change responses around the globe. Science itself, we’re told, is guiding our footsteps.
There’s just one problem: science is in deep trouble. Last year, Richard Horton, editor of the Lancet, referred to fears that ‘much of the scientific literature, perhaps half, may simply be untrue’ and that ‘science has taken a turn toward darkness.’
It’s a worrying thought. Government policies can’t be considered evidence-based if the evidence on which they depend hasn’t been independently verified, yet the vast majority of academic research is never put to this test. Instead, something called peer review takes place. When a research paper is submitted, journals invite a couple of people to evaluate it. Known as referees, these individuals recommend that the paper be published, modified, or rejected.
If it’s true that one gets what one pays for, let me point out that referees typically work for no payment. They lack both the time and the resources to perform anything other than a cursory overview. Nothing like an audit occurs. No one examines the raw data for accuracy or the computer code for errors. Peer review doesn’t guarantee that proper statistical analyses were employed, or that lab equipment was used properly. The peer review process itself is full of serious flaws, yet is treated as if it’s the handmaiden of objective truth.
And it shows. Referees at the most prestigious of journals have given the green light to research that was later found to be wholly fraudulent. Conversely, they’ve scoffed at work that went on to win Nobel prizes. Richard Smith, a former editor of the British Medical Journal, describes peer review as a roulette wheel, a lottery and a black box. He points out that an extensive body of research finds scant evidence that this vetting process accomplishes much at all. On the other hand, a mountain of scholarship has identified profound deficiencies.
October 22, 2016
Polls, voting trends, and turnouts
Jay Currie looks at the US election polling:
Polls tend to work by adjusting their samples to reflect demographics and an estimate of a given demographic’s propensity to actually vote. On a toy model basis, you can think of it as a layer cake with each layer representing an age cohort. So, for example, if you look at younger voters 18-29 you might find that 90% of them support Hilly and 10% Trump. If there are 100 of these voters in your sample of 500 a simple projection would suggest 90 votes for Hilly, 10 for Trump. The problem is that it is difficult to know how many of those younger voters will actually go out and vote. As a rule of thumb the older you are the more likely you are to vote so now you have to estimate voting propensity.
There are two ways to get a sense of voting propensity: ask the people in your sample or look at the behaviour of people the same age but in the last couple of elections.
And now the landscape begins to shift. In 2008, nearly 50% of voters aged 18-29 voted. In 2012, 40% voted. In both elections, the youth vote was heavily pro-Obama. If you were designing a poll at this point, what sort of weighting would make sense for youth voters? Making that call will change the landscape your poll will reflect. If you want your poll to tilt Hilly you can believe that the prospect of the first woman President of the United States will be as motivating as Obama was and assign a voting propensity of 40-50%; alternatively, if you don’t see many signs of Hillary catching fire among younger voters, you can set the propensity number at 30% and create a tie or a slight Trump lead.
(The results of this are even more dramatic if you look at the black vote and turnout. In 2008 black turnout was 69.1%, 2012, 67.4% with Obama taking well over 90%. Will the nice white lady achieve anything like these numbers?)
One the other side of the ledger, the turnouts of the less educated have been low for the last two elections. 52% in 2008 and a little less than 50 in 2012. There is room for improvement. Now, as any educated person will tell you, often at length, Trump draws a lot of support in the less educated cohorts. But that support is easily discounted because these people (the deplorables and their ilk) barely show up to vote.
Build your model on the basis that lower education people’s participation in 2016 will be similar to 2008 and 20012 and you will produce a result in line with the 538.com consensus view. But if you think that the tens of thousands people who show up for Trump’s rallies might just show up to vote, you will have a model tending towards the LA Times view of things.
October 1, 2016
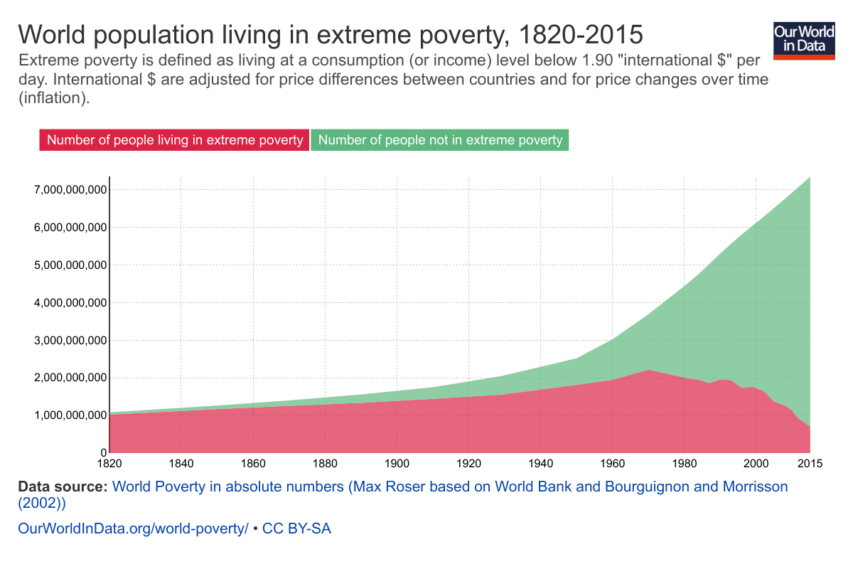
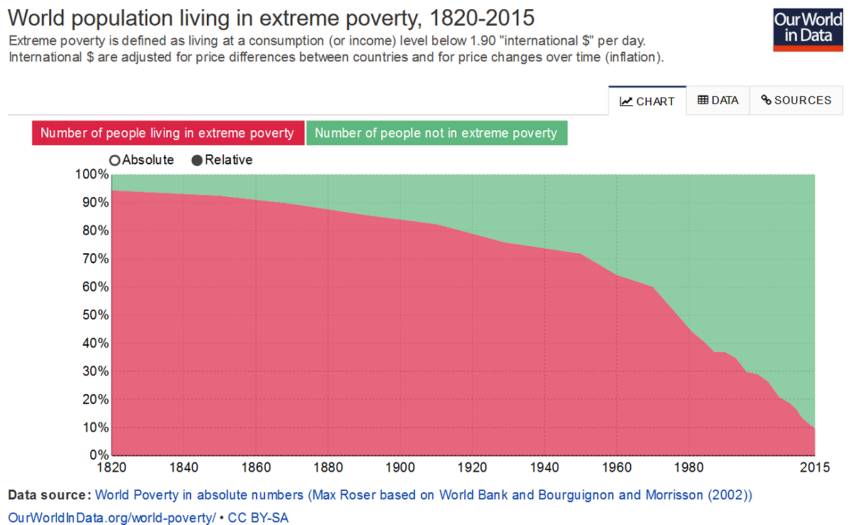
Here’s some fantastic news you’re not seeing in the headlines
The same world poverty data, presented as absolute or relative levels of poverty:
H/T to Rob Fisher at Samizdata for the link.


