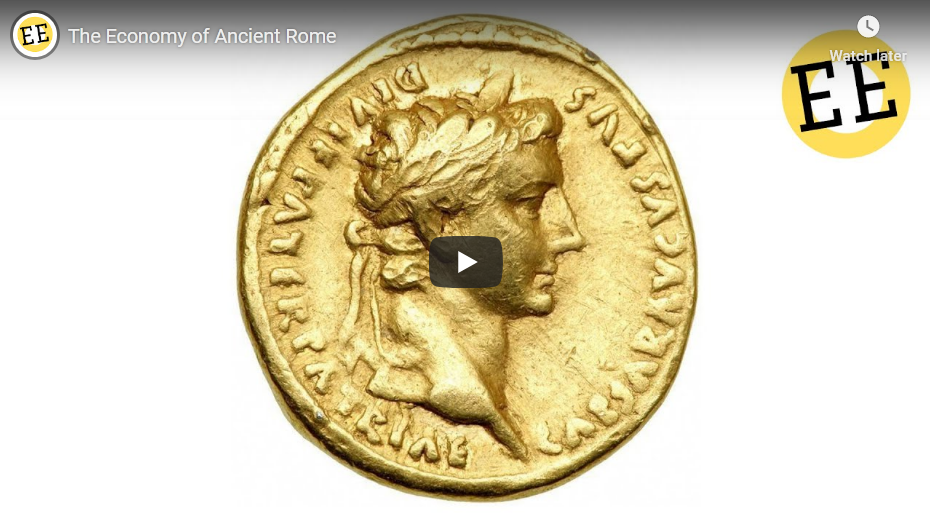
Quotulatiousness

October 11, 2017

The Great Recession

Filed under: Economics, Government, USA — Tags: , , , , — Nicholas @ 04:00

Marginal Revolution University
Published on 9 Aug 2016

There’s already been much discussion over what fueled the Great Recession of 2008. In this video, Tyler Cowen focuses on a central theme of the crisis: the failure of financial intermediaries.

By 2008, the economy was in a very fragile state, with both homeowners and banks taking on greater leverage, many ending up “underwater.” Why did managers at financial institutions take on greater and greater risk? We’ll discuss a couple of key reasons, including the role of excess confidence and incentives.

In addition to homeowners’ leverage and bank leverage, a third factor played a major role in tipping the scale toward crisis: securitization. Mortgage securities during this time were very hard to value, riskier than advertised, and filled to the brim with high risk loans. Cowen discusses several reasons this happened, including downright fraud, failure of credit rating agencies, and overconfidence in the American housing market.

Finally, a fourth factor joins homeowners’ leverage, bank leverage, and securitization to inch the economy closer to the edge: the shadow banking system. On the whole, the shadow banking system is made up of investment banks and various other complex financial intermediaries, highly dependent on short term loans.

When housing prices started to fall in 2007, it was the final nudge that pushed the economy over the cliff. There was a run on the shadow banking system. Financial intermediaries came crashing down. We faced a credit crunch, and many businesses stopped growing. Layoffs ensued, increasing unemployment.

What could have been done to prevent all of this? You’ll have to watch the video to find out.

October 5, 2017

Four Reasons Financial Intermediaries Fail

Filed under: Americas, Economics, Japan — Tags: , , , , , — Nicholas @ 02:00

Marginal Revolution University
Published on 26 Jul 2016

As we’ve discussed in previous videos, financial intermediaries bridge savers and borrowers. When these bridges crumble, the effects can be disastrous. For businesses, credit shortages can lead to bankruptcy, or layoffs. For individuals, they rely on credit to invest in education or a new home or car. These negative effects show you how crucial intermediaries are to our lives.

Still, what exactly causes failed intermediation? Four answers:

First, insecure property rights. Simply speaking, when you save money at a bank, you expect the ability to pull out your funds when needed. But what if your deposits are frozen? Or confiscated altogether? For instance, in 2013 amidst a financial crisis, the government in Cyprus confiscated bank deposits to help pay down the country’s budget shortfall. You can see how insecure property rights can scare away potential savers.

Second, controls on interest rates. Interest rates are the price of borrowing. Thus, controls on interest rates, often called usury laws, are effectively price ceilings—they set the interest rate lower than the market equilibrium interest rate. With this forced lowering of interest rates, borrowers will want to borrow more, but lenders won’t want to lend. The effect? A lending shortage.

Third, politicized lending. Banks profit by assessing risk, and then loaning, based on that assessment. Banks that excel at assessment succeed. Those poor at it die out. Problems arise when the government intervenes to prop up failing banks, resulting in what we call “zombie banks.” In such cases, intervention undercuts normal competition, and intervention tends to favor banks that are politically connected. In fact, it’s been shown that there’s an inverse correlation between government ownership in banks and a country’s GDP per capita and productivity growth.

Fourth, you have runs, panics, and scandals. Remember, trust is vital to the financial system. When trust erodes, depositors may rush to withdraw their money from banks, causing what is known as a “bank run.” This can cause banks to fail, as we saw during the Great Depression. Scandals can also depress market confidence. Enron, WorldCom and Bernie Madoff may come to mind.

So, which of these four factors contributed to the Great Recession of 2008?

We’ll discuss that in our next video.

August 13, 2017

Saving and Borrowing

Filed under: Economics — Tags: , , , — Nicholas @ 02:00

Published on 21 Jun 2016

On September 15, 2008, Lehman Brothers filed for bankruptcy, and signaled the start of the Great Recession. One key cause of that recession was a failure of financial intermediaries, or, the institutions that link different kinds of savers to borrowers.

We’ll get to intermediaries in the next video, but for now, we’ll first look at the market intermediaries are involved in.

This market is the combination of savers and borrowers — what we call the “market for loanable funds.”

To start, we’ll represent the market, using two curves you know well—supply and demand. The quantity supplied in the market comes from savings, and the quantity demanded comes from loans. But as you know, we have to factor in price. In the case of the market for loanable funds, the price is the current interest rate.

What happens to the supply of savings when the interest rate goes up? When are borrowers compelled to borrow more? Or less? We’ll cover these scenarios in this video.

One quick note: there’s not really one unified market for loanable funds. Instead, there are many small markets, with different sorts of lenders, lending to different sorts of borrowers. As we said in the beginning, it’s financial intermediaries, like banks, bond markets, and stock markets, which link these different sides of the market.

We’ll get a better understanding of these intermediaries in our next video, so stay tuned!

May 18, 2017

You Can’t Trust Employment Statistics

Filed under: Economics — Tags: , , — Nicholas @ 05:00

Published on 17 May 2017

There is no truly good way to measure unemployment, which makes it pretty easy for successive administrations to claim that unemployment is consistently improving. But when we do our level best to include all of the unemployed in the numbers, what we learn is that unemployment levels now are higher than they were at the beginning of the Great Recession. That’s the bad news. The good news is that things actually have been getting better over time. In this week’s episode, James and Antony take a look at the actual unemployment numbers to get to the bottom of what they really mean.

Get the facts here:
https://fee.org/articles/you-cant-trust-unemployment-statistics/

October 17, 2016

Hillary Clinton tells us to expect a major US recession shortly after January 20, 2017

Filed under: Economics, Government, Politics, USA — Tags: , , , , , — Nicholas @ 04:00

Fortunately, as Tim Worstall explains, politicians can rarely be believed — especially when it comes to economics:

Hillary Clinton Vows To Slam The Economy Into Recession Immediately Upon Election

This probably isn’t quite what Hillary Clinton intended to say but it is what she did say at a fundraiser on Friday night. That immediately upon election she would slam the US economy into a recession. For what she has said is that she’s not going to add a penny to the national debt. Which, in an economy running a $500 billion and change budget deficit means tax rises and or spending cuts of $500 billion and change immediately she takes the oath. And that’s a large enough and fierce enough change, before she does anything else, to bring back a recession.

[…]

Now, what she meant is something more like this. That she has some spending plans, which she does. And she is also proposing some tax rises. And that her tax rises will balance her spending plans and thus the mixture of plans will not increase the national debt. Which is possibly even true although I don’t believe a word of it myself. For her taxation plans are based upon static analyses when we really must use dynamic ones to measure tax changes. This is normally thought of as something that the right prefers. For if we measure the effects of tax cuts using the dynamic method then there will be some (please note, some, not enough for the cuts to pay for themselves) Laffer Effects meaning that the revenue loss is smaller than that under a static analysis. But this is also true about tax rises. Behaviour really does change when incentives change. Thus tax rises gain less revenue in real life than what a straight line or static analysis predicts.

That is, as I say, probably what she means. But that’s not actually what she said. She said she’ll not add a penny to the national debt. Which means that immediately on taking office she’s got to either raise taxes by $500 billion and change or reduce spending by that amount. Because the budget deficit is that $500 Big Ones and change at present and the deficit is the amount being added to the national debt each year. The problem with this being that that’s also some 3.5% or so of GDP and an immediate fiscal tightening of that amount would put the US economy back into recession.

January 1, 2015

The Laffer Curve at 40

Filed under: Business, Economics, Government, USA — Tags: , , , , , — Nicholas @ 11:39

In the Washington Post, Stephen Moore recounts the tale of the most famous napkin in US economic history:

It was 40 years ago this month that two of President Gerald Ford’s top White House advisers, Dick Cheney and Don Rumsfeld, gathered for a steak dinner at the Two Continents restaurant in Washington with Wall Street Journal editorial writer Jude Wanniski and Arthur Laffer, former chief economist at the Office of Management and Budget. The United States was in the grip of a gut-wrenching recession, and Laffer lectured to his dinner companions that the federal government’s 70 percent marginal tax rates were an economic toll booth slowing growth to a crawl.

To punctuate his point, he grabbed a pen and a cloth cocktail napkin and drew a chart showing that when tax rates get too high, they penalize work and investment and can actually lead to revenue losses for the government. Four years later, that napkin became immortalized as “the Laffer Curve” in an article Wanniski wrote for the Public Interest magazine. (Wanniski would later grouse only half-jokingly that he should have called it the Wanniski Curve.)

This was the first real post-World War II intellectual challenge to the reigning orthodoxy of Keynesian economics, which preached that when the economy is growing too slowly, the government should stimulate demand for products with surges in spending. The Laffer model countered that the primary problem is rarely demand — after all, poor nations have plenty of demand — but rather the impediments, in the form of heavy taxes and regulatory burdens, to producing goods and services.

[…]

Solid supporting evidence came during the Reagan years. President Ronald Reagan adopted the Laffer Curve message, telling Americans that when 70 to 80 cents of an extra dollar earned goes to the government, it’s understandable that people wonder: Why keep working? He recalled that as an actor in Hollywood, he would stop making movies in a given year once he hit Uncle Sam’s confiscatory tax rates.

When Reagan left the White House in 1989, the highest tax rate had been slashed from 70 percent in 1981 to 28 percent. (Even liberal senators such as Ted Kennedy and Howard Metzenbaum voted for those low rates.) And contrary to the claims of voodoo, the government’s budget numbers show that tax receipts expanded from $517 billion in 1980 to $909 billion in 1988 — close to a 75 percent change (25 percent after inflation). Economist Larry Lindsey has documented from IRS data that tax collections from the rich surged much faster than that.

November 18, 2014

Finland’s Great(est) Depression

Filed under: Economics, Europe — Tags: , , — Nicholas @ 00:03

Lars Christensen explains why — economically speaking — Finland is suffering through an economic phenomena even worse than the Great Depression:

In my post from Friday — Italy’s Greater Depression — Eerie memories of the 1930s — I inspired by the recent political unrest in Italy compared the development in real GDP in Italy during the recent crisis with the development in the 1920s and 1930s.

The graph in that blog post showed two things. First, Italy’s real GDP lose in the recent crisis has been bigger than during 1930s and second that monetary easing (a 41% devaluation) brought Italy out of the crisis in 1936.

I have been asked if I could do a similar graph on Finland. I have done so — but I have also added the a third Finnish “Depression” and that is the crisis in the early 1990s related to the collapse of the Soviet Union and the Nordic banking crisis. The graph below shows the three periods.

Three Finnish depressions

[…]

The most interesting story in the graph undoubtedly is the difference in the monetary response during the 1930s and during the present crisis.

In October 1931 the Finnish government decided to follow the example of the other Nordic countries and the UK and give up (or officially suspend) the gold standard.

The economic impact was significant and is very clearly illustrate in the graph (look at the blue line from year 2-3).

We have nearly imitate take off. I am not claiming the devaluation was the only driver of this economic recovery, but it surely looks like monetary easing played a very significant part in the Finnish economic recovery from 1931-32.

October 16, 2014

Italian recession officially ends, thanks to drugs and prostitution

Filed under: Economics, Europe, Italy — Tags: , , , , — Nicholas @ 10:21

As Kelly McParland put it, it’s “another reason to legalize everything nasty“:

Italy learnt it was no longer in a recession on Wednesday thanks to a change in data calculations across the European Union which includes illegal economic activities such as prostitution and drugs in the GDP measure.

Adding illegal revenue from hookers, narcotics and black market cigarettes and alcohol to the eurozone’s third-biggest economy boosted gross domestic product figures.

GDP rose slightly from a 0.1 percent decline for the first quarter to a flat reading, the national institute of statistics said.

Although ISTAT confirmed a 0.2 percent decline for the second quarter, the revision of the first quarter data meant Italy had escaped its third recession in the last six years.

The economy must contract for two consecutive quarters, from output in the previous quarter, for a country to be technically in recession.

It’s merely a change in the statistical measurement, not an actual increase in Italian economic activity. And, given that illegal revenue pretty much by definition isn’t (and can’t be) accurately tracked, it’s only an estimated value anyway.

October 14, 2014

A new view on cosplay – as a symptom of a seriously weakened economy

Filed under: Economics, Japan, Media — Tags: , , , , — Nicholas @ 15:06

A certain amount of this rings true:

Imagine you’re a college graduate stuck in a perpetually lousy economy. That’s a problem Japanese twenty-somethings have faced for more than 20 years. Two decades of stagnation after the collapse of the 1980s real-estate and stock bubbles — combined with labor laws making it tough to fire older workers — have relegated vast numbers of Japanese young adults to low-paying, temporary contract jobs. Many find themselves living with their parents well into their twenties and beyond, unmarried and childless.

Then again, they do have plenty of time to dress up like wand-wielding sailor girls and cybernetic alchemist soldiers from the colorful world of anime cartoons and manga comics. Indeed, Japan’s Lost Decades have coincided with a major spike in “people escaping to virtual worlds of games, animation, and costume play,” Masahiro Yamada, a sociology professor at Chuo University in Tokyo, recently told the Financial Times. “Here, even the young and poor can feel as though they are a hero.”

It’s hard to blame them. After all, it’s not that these young adults in Japan are resisting becoming productive members of the economy — it’s that there just aren’t enough opportunities for them. So an increasingly large number of them spend an increasingly large amount of time living in make-believe fantasy worlds, pretending they are someone else, somewhere else. This is a very bad thing for the Japanese economy.

And guess what: America has a growing number of make-believe “cosplay” heroes, too. Many of the 130,000 people who attend the San Diego Comic Con every year invest big bucks in elaborate outfits as a way of showing off their favorite Japanese characters, as well as those from American superhero movies, comics, and “genre” televisions shows such as Game of Thrones. And this trend is growing — the crowd at Comic Con was one-third this size in 2000. In 2013, the SyFy channel even created a reality show about the trend, Heroes of Cosplay.

H/T to Ghost of a Flea for the link.

April 30, 2014

Disturbing US unemployment figures

Filed under: Economics, Government, USA — Tags: , — Nicholas @ 06:58

Michael Snyder says the official unemployment rate actually conceals more than it reveals:

According to shocking new numbers that were just released by the Bureau of Labor Statistics [PDF], 20 percent of American families do not have a single person that is working. So when someone tries to tell you that the unemployment rate in the United States is about 7 percent, you should just laugh. One-fifth of the families in the entire country do not have a single member with a job. That is absolutely astonishing. How can a family survive if nobody is making any money? Well, the answer to that question is actually quite easy. There is a reason why government dependence has reached epidemic levels in the United States. Without enough jobs, tens of millions of additional Americans have been forced to reach out to the government for help. At this point, if you can believe it, the number of Americans getting money or benefits from the federal government each month exceeds the number of full-time workers in the private sector by more than 60 million.

[…]

A number that I find much more useful is the employment-population ratio. According to the employment-population ratio, the percentage of working age Americans that actually have a job has been below 59 percent for more than four years in a row…

US Employment-Population Ratio 2002-2014

That means that more than 41 percent of all working age Americans do not have a job.

When people can’t take care of themselves, it becomes necessary for the government to take care of them. And what we have seen in recent years is government dependence soar to unprecedented levels. In fact, welfare spending and entitlement payments now make up 69 percent of the entire federal budget.

November 10, 2013

Growth forecasts continue to over-estimate Canada’s actual economic progress

Filed under: Cancon, Economics — Tags: , , , , — Nicholas @ 12:12

In Maclean’s, Debbie Downer Colin Campbell takes a survey of the state of Canada’s economy:

A key qualification for landing a job at the Bank of Canada, it seems, is an unfailing sense of optimism. In 2009, the bank forecast the economy would grow 3.3 per cent in 2011. It grew 2.5 per cent. In 2011, it said the economy would grow 2.9 per cent in 2013. It will likely be just 1.6 per cent. Now it says the economy will grow 2.3 per cent next year. How likely is that? The bank has consistently viewed the economy through rose-coloured glasses in recent years, perhaps believing its low-interest-rate policy will eventually bear fruit. Rates have been held at one per cent for three years now. But the economy seems only to be getting worse.

It grew 0.3 per cent in August, Statistics Canada said last week — mostly attributed to a familiar crutch, the oil business. Elsewhere, things aren’t looking up. A new TD Bank report said corporate Canada is “in a slump,” with profits down 16 per cent from their post-recession peak in 2011. Some observers point out that Canada is still doing better than Europe and Japan. But so are most countries that aren’t in a recession, from South Africa and New Zealand to Equatorial Guinea and Guatemala. After breezing through the recession, Canada is back to old habits: hoping its fortunes (i.e., exports) will rise along with America’s comeback. But the U.S., too, is back in a rut. Last week, the Federal Reserve said it would continue with its $85-billion-a-month bond-buying stimulus program.

With the economy sputtering, Ottawa has meanwhile remained preoccupied with fiscal restraint and balancing the budget within two years. So, with neither low interest rates nor government spending providing a boost, the outcome seems predictable: Official growth forecasts will look nice, but will keep missing the mark.

August 30, 2013

Economic Darwinism – you’re soaking in it

Filed under: Economics, Government — Tags: , , , — Nicholas @ 09:19

Charles Hugh Smith on the next big financial crisis and the way we’ve carefully put the worst people in place to cope with it:

Brenton Smith (no relation) recently identified a key driver of the next financial crisis: Economic Darwinism. Just as natural selection selects for traits that improve the odds of success/survival in the natural world, Economic Darwinism advances people and policies that boost profits and power within the dominant environment.

As Brenton explains in his essay The One Phrase That Explains the Great Recession, “The Federal Reserve’s 20-year policy of easy money created an environment virtually assured to select bankers, bureaucrats, educators, and elected officials who least understood the consequences of a credit crisis.

In other words, a hyper-financialized environment of near-zero interest and abundant credit rewarded those people and policies that succeed in that environment. Once the environment changes from “risk-on” to “risk-off,” the people and policies in charge are the worst possible choices for leadership, as the traits that enable successful management of credit crises have been selected out of the leadership pool.

This has political as well as financial consequences. As Brenton noted in an email exchange, Economic Darwinism creates an “incestuous relationship between Wall Street and Washington D.C., where success on Wall Street leads to a career in D.C.” This is a self-reinforcing process, as all those who are unwilling to keep dancing during the risk-on speculative orgy are weeded out of both the financial and political sectors, while those who dance the hardest gain political power, which they use to keep the music playing regardless of the increasing risks or consequences to the nation.

June 6, 2013

IMF forced to admit that the Greek bailout “included notable failures”

Filed under: Economics, Europe, Greece — Tags: , , , , — Nicholas @ 08:58

In the Guardian, Larry Elliott, Phillip Inman and Helena Smith round up the IMF’s self-criticisms over the handling of the bailout package imposed on Greece:

In an assessment of the rescue conducted jointly with the European Central Bank (ECB) and the European commission, the IMF said it had been forced to override its normal rules for providing financial assistance in order to put money into Greece.

Fund officials had severe doubts about whether Greece’s debt would be sustainable even after the first bailout was provided in May 2010 and only agreed to the plan because of fears of contagion.

While it succeeded in keeping Greece in the eurozone, the report admitted the bailout included notable failures.

“Market confidence was not restored, the banking system lost 30% of its deposits and the economy encountered a much deeper than expected recession with exceptionally high unemployment.”

In Athens, officials reacted with barely disguised glee to the report, saying it confirmed that the price exacted for the €110bn (£93bn) emergency package was too high for a country beset by massive debts, tax evasion and a large black economy.”

Under the weight of such measures — applied across the board and hitting the poorest hardest — the economy, they said, was always bound to dive into an economic death spiral.

May 16, 2013

The causes of the “Great Recession” by Tyler Cowen

Filed under: Business, Economics, Government, USA — Tags: , , — Nicholas @ 09:11

According to Professor Tyler Cowen, the Great Recession was caused by a number of different factors. Cowen outlines 4 distinct and complicated problems which led to the downturn:

• A drop in the aggregate demand (http://en.wikipedia.org/wiki/Aggregat…)
• A “horribly” performing banking sector
• Problems with monetary policy
• An increase in the “risk premium” (http://en.wikipedia.org/wiki/Risk_pre…)

Prof. Cowen explains why one economic model isn’t sufficient to explain the economic downturn. He shows how several different economic models can be used to explain both the cause and the effects of the recession.

March 5, 2013

China claims the shipbuilding title

Filed under: Business, China — Tags: , , , — Nicholas @ 09:02

Strategy Page talks about the success of Chinese shipyards:

Last year South Korea lost its decade long battle with China to retain its lead in ship building. Because of a five year depression in the world market for shipping, South Korean ship exports fell 30 percent last year, to $37.8 billion. China, helped by government subsidies, saw ship exports fall only 10.3 percent, leaving China with $39.2 billion in export sales. The Chinese government has also been giving its ship builders lots of new orders for warships, which made its yards more profitable and better able to beat South Korea on price. The Chinese government also provides its ship builders with more loans, allowing the builders to offer better credit terms to customers. South Korea is still ahead of China in total orders for ships. As of last year South Korea had 35 percent of these orders versus 33.3 percent for China.

China has been helping its shipyards for over a decade and that has enabled Chinese ship builders to gradually catch up to South Korea and Japan. It was only four years ago, sooner than anyone expected, that China surpassed South Korea as the world’s largest shipbuilder in terms of tonnage. In late 2009, Chinese yards had orders for 54.96 million CGT of ships, compared to 53.63 million CGT for South Korea. Thus China had 34.7 percent of the world market. In 2000, South Korea took the lead from Japan by having the largest share of the world shipbuilding market.

CGT stands for Compensated Gross Tons. This is a new standard for measuring shipyard effort. Gross tons has long been used as a measure of the volume within a ship. CGT expands on this by adding adjustments for the complexity of the ship design. Thus a chemical tanker would end up with a value four times that of a container ship. China is producing far more ships, in terms of tonnage of steel and internal volume, than South Korea, mainly because a much larger portion of Chinese ships are simple designs. South Korea has, over the years, pioneered the design, and construction, of more complex ships (chemical, and Liquid Natural gas carriers.)

« Newer PostsOlder Posts »

Powered by WordPress