Quotulatiousness

February 10, 2012

Lorne Gunter: Toronto Star imagines oil just “bubbles up out of the ground and we Westerners just run out with buckets to collect it?”

Filed under: Cancon, Economics, Media — Tags: , , , , , — Nicholas @ 10:30

Lorne Gunter in the National Post:

As I read the Toronto Star’s editorial about Statistics Canada’s recently released 2011 census population data, it was hard for me not to imagine a plump, aging diva reclining on a brocade-covered chaise wailing, “I’m still beautiful! Really, I am.”

Entitled, “Census shows a fading Ontario? Don’t count on it,” the editorial makes the argument that it is “too simplistic” to claim “Ontario’s day is over.”

No one is making the case that Ontario can be dismissed as an afterthought. That is a concern without a cause.

[. . .]

But before anyone jumps to the conclusion that I, an Albertan, am pleased by Ontario’s decline, I’ll add that any trend that bodes ill for Ontario, eventually bodes ill for the country as a whole.

Canada needs a strong, prosperous, confident heartland. The West may be the new engine of the national economy, but that doesn’t mean the country can afford to have the old engine — Ontario — be idle.

The Star insults the West’s ingenuity and determination when it scoffs that “it’s relatively easy to grow based on resource extraction. Ontario does not have the luxury of sitting on gas and oil fields, so the task here is much harder.” Really? Have the paper’s editorial writers ever tried to find, extract, transport and refine oil and natural gas? Do they imagine the stuff bubbles up out of the ground and we Westerners just run out with buckets to collect it?

January 28, 2012

Revising the NFL’s rating system

Filed under: Football — Tags: , — Nicholas @ 13:32

The NFL keeps lots and lots of statistics, but the traditional way of ranking teams is based on total yardage gained and lost. Using that measurement, the two worst defensive teams in the league were the top seeds in their respective conferences, and one of them is appearing in the Super Bowl next week. That doesn’t seem to be an accurate way of comparing teams, as John Holler points out:

A more accurate reflection should be taking in three factors, not just yards gained or allowed. In realistic terms, there should be two other criteria measured. Seeing as games are decided by points scored, that should be factored in. Also, there are defenses that are known as “bend, don’t break.” They allow yards, but, once in the red zone, they stiffen up and turn potential touchdowns into field goals.

While not a perfect system, the numbers bear out that this is a much more accurate reflection of the true value of an offense or a defense. According to the “official” numbers, the Eagles were a top-eight team in both offense and defense. Reality said otherwise.

What follow are VU’s reality rankings of NFL offenses and defenses. Each team is ranked in three categories – yards, points and red zone touchdown percentage. The first figure is where offenses and defenses were ranked for comparison purposes.

[. . .]

Offense

Defence

1. New England – 2-3-2 (7)
2. Green Bay – 3-1-3 (7)
3. New Orleans – 1-2-6 (9)
4. Detroit – 5-4-4 (13)
5. Carolina – 7-5½-7 (19½)
6. San Diego – 6-5½-10 (21½)
7. N.Y. Giants – 8-9-8 (25)
8. Philadelphia – 4-8-14 (26)
9. Atlanta – 10-7-13 (30)
10. N.Y. Jets – 25-13-1 (39)
11. Buffalo – 14-14-11 (39)
12. Oakland – 9-16-16 (41)
13. Tennessee – 17-21½-5 (43½)
14. Baltimore – 15-12-17 (44)
15. Dallas – 11-15-20 (46)
16. Minnesota – 19-19-9 (46)
17. Houston – 13-10-25 (48)
18. Pittsburgh – 12-21½-18 (51½)
19. Chicago – 24-17-12 (53)
20. Arizona – 19-24-15 (58)
21. Cincinnati – 20-18-26 (64)
22. Miami – 22-20-24 (66)
23. Tampa Bay – 21-27-19 (67)
24. San Francisco – 26-11-30 (67)
25. Denver – 23-25-23 (71)
26. Washington – 16-26-29 (71)
27. Seattle – 28-23-22 (73)
28. Jacksonville – 32-28½-21 (81½)
29. Indianapolis – 30- 28½-27 (85½)
30. Cleveland – 29-30-28 (87)
31. Kansas City – 27-31-32 (90)
32. St. Louis – 31-32-31 (94)

1. Baltimore – 3-3-1 (7)
2. San Francisco – 4-2-4 (10)
3. Houston – 2-4-9 (15)
4. Pittsburgh – 1-1-17 (19)
5. Cleveland – 10-5-3 (18)
6. Miami – 15-6-6 (27)
7. Seattle – 9-7-11 (27)
8. Tennessee – 18½-8-10 (36½)
9. Arizona – 18½-17-2 (37½)
10. Chicago – 17-14-7 (38)
11. Atlanta – 12-18-8 (38)
12. Washington – 13-21-5 (39)
13. Jacksonville – 6-11-23 (40)
14. N.Y. Jets – 5-20-16 (41)
15. Cincinnati – 7-9-25 (41)
16. Kansas City – 11-12-18 (41)
17. Philadelphia – 8-10-30 (48)
18. Dallas – 14-16-19 (49)
19. Detroit – 23-23-12 (58)
20. Denver – 20-24-15 (59)
21. St. Louis – 22-26-13 (61)
22. New Orleans – 24-13-28 (65)
23. Minnesota – 21-31-14 (66)
24. San Diego – 16-22-29 (67)
25. New England – 31-15-21½ (67.5)
26. Green Bay – 32-19-20 (71)
27. N.Y. Giants – 27-25-21½ (73½)
28. Carolina – 28-27-27 (82)
29. Indianapolis – 25-28-31 (84)
30. Oakland – 29-29-26 (84)
31. Tampa Bay – 30-32-24 (86)
32. Buffalo – 26-30-32 (88)

January 25, 2012

Lorne Gunter: The long-gun registry was broken from the start

Filed under: Bureaucracy, Cancon, Law, Liberty — Tags: , , , — Nicholas @ 10:55

Writing in the National Post, Lorne Gunter points out that the long-gun registry was even less useful than we thought:

Last month, the RCMP and Statistics Canada were forced to admit that they don’t keep statistics relating to the number of violent gun crimes in Canada that are committed by licensed gun owners using registered guns.

“Please note,” Statistics Canada wrote in response to an access to information request filed by the National Firearms Association, “that the Uniform Crime Reporting (UCR) survey does not collect information on licensing of either guns or gun owners related to the incidents of violent crime reported by police.” Nor does StatsCan’s annual homicide survey “collect information on the registration status of the firearm used to commit a homicide.”

This raises the question: Why did it take so long for the government to begin ridding Canada of the horribly expensive, unjustifiably intrusive federal gun registry? If no one in Ottawa had any systematic way of tracking whether or not Canadians suspected of committing a violent gun crime were licensed to own a gun and had registered the gun being used, then they had no way of knowing whether registration and licensing were having a positive impact on crime.

There are around 340,000 violent crimes reported to police in Canada each year. Just over 2% of those (around 8,000) involve firearms. (There’s another reason to question the initial wisdom of the gun registry: Why was Ottawa expending so much time, effort and taxpayer money on such a tiny percentage of violent crimes, while doing comparatively little to prevent the 98% of murders, robberies, kidnappings, rapes and beatings not committed with a gun?)

Even if you grant the original notion that the government had an overriding need to track gun ownership (over and above the user licensing scheme that pre-dated the registry by decades), this can only count as a waste of time, money, and effort.

January 21, 2012

Robert Johnson: How to save Economics

Filed under: Economics, Education, History, Media — Tags: , , , — Nicholas @ 11:10

Writing in Time, Robert Johnson has a few recommendations to rescue the field of economics from its current state:

First, economists should resist overstating what they actually know. The quest for certainty, as philosopher John Dewey called it in 1929, is a dangerous temptress. In anxious times like the present, experts can gain great favor in society by offering a false resolution of uncertainty. Of course when the falseness is later unmasked as snake oil, the heroic reputation of the expert is shattered. But that tends to happen only after the damage is done.

Second, economists have to recognize the shortcomings of high-powered mathematical models, which are not substitutes for vigilant observation. Nobel laureate Kenneth Arrow saw this danger years ago when he exclaimed, “The math takes on a life of its own because the mathematics pushed toward a tendency to prove theories of mathematical, rather than scientific, interest.”

[. . .]

The third remedy for repairing economics is to reintroduce context. More research on economic history and evidence-based studies are needed to understand the economy and overcome the mechanistic bare-bones models the students at Harvard objected to being taught.

[. . .]

Fourth, we must acknowledge the intimate, inseparable relationship between politics and economics. Modern debates about who caused the financial crisis — ­government or the private financial sector — are almost ­nonsensical. We are living in an era of money politics and large powerful interests that influence the laws and regulations and their enforcement. In order to catalyze the evolution of economics, research teams would benefit from multidisciplinary interaction with politics, psychology, anthropology, sociology and history.

H/T to Tim Harford for the link.

January 20, 2012

Calculating the real benefits of international trade

Filed under: Cancon, Economics — Tags: , , — Nicholas @ 10:12

Kevin Carmichael has an article in the Globe and Mail Economy Lab on the attempts to determine the actual benefits a country derives from international trade:

Currency traders love the monthly import and export data, which provide an excellent guide of how much demand exists for dollars, euros, yen, francs and the like.

But for anyone seeking a more precise understanding of the dynamics of international trade, the data compiled by customs agents are about as about as relevant to a modern economy as carbon paper.

The reason: supply chains. Virtually nothing is produced entirely within a single border anymore. Companies outsource everything from components to packaging. That means a good can cross a border several times on its way to becoming a final product. Each time, it’s value increases. That value is what the customs agent enters in his or her computer. But that inflates the actual contribution of that good to a country’s economy.

It is relatively early days, but some economists are trying to develop a more useful measure of international trade. Among them is the Conference Board of Canada, which Thursday released the first of three reports based on what it calls “value-added trade.” The report should be required reading in Ottawa. Its conclusions challenge much of what we think we know about the nature of Canada’s economy.

January 18, 2012

First they came for the smokers, then the drinkers, and now the meat-eaters

Filed under: Britain, Government, Health, Liberty — Tags: , , , — Nicholas @ 10:52

Rob Lyons on the flimsy case for declaring that “eating meat causes cancer”, and the rising tide of buttinsky government and their nudge, hector, prod, and persecute urges:

Meat causes cancer. It’s been said so many times that you’d have to be an idiot not to believe it, right?

The latest confirmation of this apparent common sense was a report published last week in the British Journal of Cancer Research. The authors, from the Karolinska Institute in Sweden, brought together 11 studies — published between 1993 and 2011 — that assessed the risk of pancreatic cancer from eating red meat and ‘processed’ meat. From this meta-analysis, the authors found that red meat increased the risk of pancreatic cancer for men, but not for women, and that the risk of pancreatic cancer rose by 19 per cent for every 50 grams of processed meat consumed.

The simple claim that ‘processed meat causes cancer’ was widely reported after the study was published. However, it would be wrong to assume that such claims about risk are all they are cracked up to be.

[. . .]

There are so many ways in which the crude tools of epidemiology could screw up the result of studies like this that it is normal for fairly small risks — like the 19 per cent increase in this case — to be treated with a massive pinch of salt. The authors of this study even note: ‘All studies controlled for age and smoking, but only a few studies adjusted for other potential confounders such as body mass index and history of diabetes.’

[. . .]

So, to sum up: the association between processed meat and pancreatic cancer is so weak it might well be a mirage; the increased risk might not be caused by the processed meat itself; and even if it is, the risk is so low that it’s really not worth bothering about. Yet still we are advised to consider cutting down on our red meat and processed meat consumption. Life is, frankly, too short to miss out on such tasty foods on the slim chance that we might lose a few years of life in old age.

[. . .]

Now that the precedent has been set for the government to lambast those who engage in unapproved habits, it’s open season on any habit that a campaigner or columnist disapproves of. Ban it! Tax it! Make them get a prescription for it! Deny them medical care! Ellen’s article is objectionable but it only follows the remorseless logic of so many others.

There is another lesson from the meat-and-cancer story: at a time when all sorts of dubious claims are made based on junk science and dodgy statistics, only some panics get wide publicity; others just pop up and disappear again in a matter of hours. The difference is that some play to an existing political or media agenda and some do not. The idea that meat causes cancer appeals to health busybodies, politicians scrabbling around for a sense of purpose, vegetarians who can’t win a moral argument about animal rights, and environmentalists who have failed to convince us that increasing the ‘human footprint’ — by wanting to eat more meat, for example — is killing the planet.

January 15, 2012

As you’d expect, healthcare costs are not evenly distributed

Filed under: Economics, Health, USA — Tags: , , , — Nicholas @ 12:20

Jordan Weissmann in The Atlantic:

When it comes to America’s spiraling health care costs, the country’s problems begin with the 5%. In 2008 and 2009, 5% of Americans were responsible for nearly half of the country’s medical spending.

Of course, health care has its own 1% crisis. In 2009, the top 1% of patients accounted for 21.8% of expenditures.

The figures are from a new study by the Department of Health and Human Services, which examined how different U.S. demographics contributed to medical costs. It looked at the $1.26 trillion spent by civilian, non-institutionalized Americans each year on health care.

The top 5% of spenders paid an annual average of $35,829 in doctors’ bills. By comparison, the bottom half paid an average $232 and made up about 3% of total costs.

January 5, 2012

The MPAA over-cooks their numbers to support SOPA

Filed under: Economics, Law, Media, Technology, USA — Tags: , , , , , — Nicholas @ 09:53

Techdirt reports on the work done by Julian Sanchez at the Cato Institute to actually scrutinize the “loss” numbers used by the MPAA:

One of the things we’ve noticed in the debate over SOPA and PIPA is just how the other side is really lying with statistics. We’ve done a thorough debunking of the stats used by the US Chamber of Commerce to support both bills, as well as highlighted the misleading-to-bogus stats used by Lamar Smith in his support of the bill.

But every day, more bogus stats are rolled out. Julian Sanchez, over at the Cato Institute, has decided to dig into one specific bogus number, the supposed claim of $58 billion in “losses,” and to show how the numbers don’t hold up to any scrutiny. In fact, using the details of where the numbers came from, Sanchez makes the case that SOPA won’t save a single net job for the US economy. Read on to find out how.

First off, the $58 billion comes from an absolutely laughable report for the Institute for Policy Innovation, done every year by Stephen Siwek at a firm called Economists Incorporated. We’ve challenged this ridiculous number in the past, but not to the level of detail that Sanchez has here. He starts out by bringing up (as we have many times), Tim Lee’s excellent debunking of the ridiculous “ripple effects” that Siwek/IPI always use, despite them being a trick to double, triple, quadruple, etc count the same dollars [. . .]

January 3, 2012

Blog statistics for non-statisticians

Filed under: Administrivia, Technology — Tags: , — Nicholas @ 10:01

I’m not a big stats nerd — being mathematically challenged means I’m less willing to devote time to things that require extra math. However, most if not all bloggers do care about a few statistical measurements: how many people are visiting their blogs. I’m no exception to that rule.

I don’t have a complete series of annual numbers, as the tools under MovableType (the old site) and WordPress (the current site) don’t provide quite the same slices of data. I installed SiteMeter on the old site a couple of months after I started blogging and it shows 414,416 unique visits from 17 August, 2004 to today (and it still gets around 100 visits per day, even though I haven’t been posting there for more than two years).

Since I switched to the current site the traffic has been going up, although the big blogs don’t have to worry that I’m drawing too much of their readership:

  • 2009: 58,121 unique visits, 131,825 hits (site went live in July, stats date from mid-August)
  • 2010: 328,374 unique visits, 825,381 hits
  • 2011: 413,463 unique visits, 1,118,497 hits

That concludes our occasional dip into the statistics. Thanks for coming by, and especially thanks to folks that link to my blog.

Update: I happened across this bit from July, 2009 on the old blog that still seems relevant:

I’m not sure why I’ve been blogging for five years … it’s certainly not the money, booze, and groupies! I’ve thought about stepping away from the keyboard every now and again, but I don’t actually write as much as I once did, so large chunks of my “blogging” time are actually copy-paste-and-code sessions, rather than writing.

The blogroll has certainly diminished in importance over the last couple of years. The Red Ensign bloggers, my primary affiliation, has diminished to about a dozen active blogs, of whom perhaps 5-6 produce the vast majority of posts. Other blogrolls I’m on have similar profiles of activity. Blogrolls don’t matter compared to when I first started blogging back in 2004.

I remember worrying about SiteMeter and the Ecosystem, as they showed me what my visitors were reading, where they came from and where they went. Time has also not been kind to the ease of gathering that sort of information, as more readers come in from search engine results, RSS feeds, and goodness knows what other channels. If/when I move the blog over to the new site, I may not bother including the links for those tools. They’re no longer all that useful or informative.

I do miss the cameraderie of the early blogging years … but as more of the early blogs go dark, the replacements are less likely to be bloggers and more likely to be Twitterers, Facebookers, YouTubers, Farkers, Slashdotters, and all the other Web 2.0/New Media options that are now available. What was that old expression about the only constant being change?

December 21, 2011

Barbara Kay: Spousal abuse is remarkably gender-balanced

Filed under: Cancon, Law, Media — Tags: , , , , — Nicholas @ 10:18

Everyone knows the old myth about a spike in wife-beating after major sporting events (most frequently referenced is the Superbowl, but the same factoid is trotted out about every “big game”). Barbara Kay reveals the awkward truth that nearly half of all spousal abuse is by female partners:

One of first-wave feminism’s great achievements in the 1970s was to end the denial surrounding wife abuse in even the “best” homes. Resources for abused women proliferated. Traditional social, judicial and political attitudes toward violence against women were cleansed and reconstructed along feminist-designed lines.

But then a funny thing happened. The closet from which abuse victims were emerging had, everyone assumed, been filled with women. But honest researchers were surprised by the results of their own objective inquiries. They were all finding, independently, that intimate partner violence (IPV) is mostly bidirectional.

But by then the IPV domain was awash in heavily politicized stakeholders. Even peer-reviewed community-based studies providing politically incorrect conclusions were cut off at the pass, their researchers’ names passed over for task force appointments and the writing of training manuals for the judiciary. Neither were internal whistle-blowers suffered gladly. Erin Pizzey, who opened the first refuge for battered women in England in 1971, was “disappeared” from the feminist movement when she revealed what she learned in her own shelter: She committed a heresy by asking women about their own violence, and they told her.

[. . .]

(While the CDC survey does not reference Canadian data, our IPV statistics vary significantly from the U.S.’s in certain respects. “Minor” wife assault rates as measured on the commonly employed Conflict Tactics Scale are identical, but “severe violence” rates in Canada fall as the violence ratchets up. For “kicking” and “hitting,” Canadian rates were 80% of the American rate; for “beat up,” they were 25%; and for “threatened with or used a gun/knife,” they were only 17%.)

By now there is no excuse for the failure of governments at all levels to follow through on — or at least acknowledge — the settled science of bilateral violence. Yet just last week the Justice Institute of British Columbia issued a lengthy report on “Domestic Violence Prevention and Reduction,” and sure enough, it defines domestic violence as “intimate partner violence against women,” recommending only that government work “to bridge gaps in the services and systems designed to protect women and children.”

One area where the majority of abusers are female is child abuse: women are much more likely to batter their children than men.

December 15, 2011

Grim, crime-wracked, post-apocalyptic Toronto ranks … 52nd most dangerous in Canada

Filed under: Cancon, Law, Liberty — Tags: , , , , — Nicholas @ 09:29

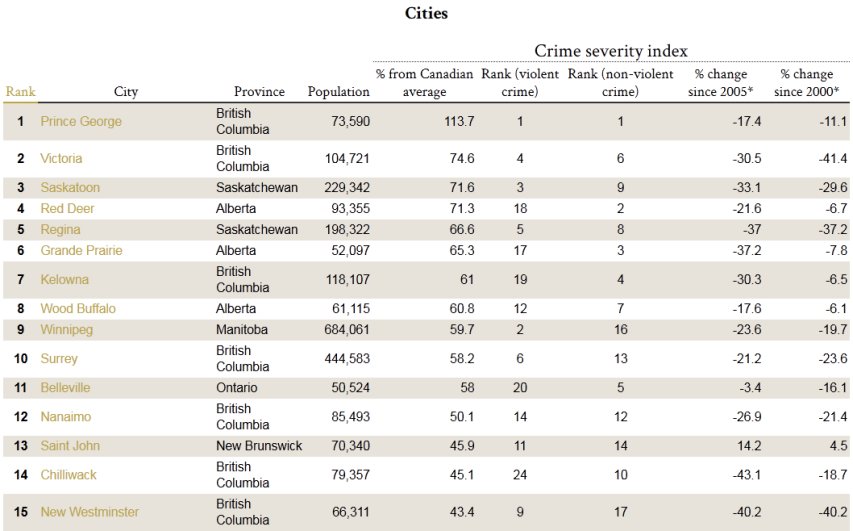
Everyone in Canada knows that Toronto is a cess-pit of crime where the oppressed citizenry huddle in fear, while idyllic Victoria is a benign, peaceful enclave of happiness. But what we know just ain’t so:

Toronto ranks 52nd among cities and towns in the country for the label “most dangerous” according to Maclean’s. Victoria, BC? Far from being a peaceful place, ranks second in the country after Prince George, BC. In fact, BC has four of the top ten dangerous cities, while Ontario’s most dangerous place, Belleville, clocks in at number 11.

December 8, 2011

Health advocates argue in advance of the data in new cancer study

Filed under: Britain, Health, Media — Tags: , , , , — Nicholas @ 08:36

Rob Lyons on the latest cancer study, which makes unsubstantiated claims about the “lifestyle” causes of cancer:

The essential idea we are being sold here is that medical experts know that certain behaviours — like smoking, drinking alcohol, eating read meat and not eating enough fruit and vegetables — increase your risk of developing cancer by a certain percentage. So, all we need to do is work out how many people would have got cancer if no one did any of those things, take that number away from the number of people who do get cancer, and the remainder is how many people that ‘unhealthy living’ is killing. Simple, right?

According to the report, If you do all the ‘right’ things — if you are a cigarette-dodging, skinny teetotaller who avoids all red meat, barely goes out in the sun (except, perhaps, to take the prescribed 30-minute sessions of exercise five times per week), gets lashings of fibre, cuts down on salt, avoids infectious diseases and ionising radiation, and so on — then you can cut your cancer risk by over 40 per cent. On that basis, you may avoid cancer but die of boredom instead.

More specifically, even in this report there’s a huge gulf between the widely acknowledged risk of smoking — which is estimated here to cause 19.4 per cent of all cancers — and other risk factors. Smoking accounts for nearly half the lifestyle risk of 43 per cent claimed in the report. The next biggest factors suggested are overweight and obesity (5.5 per cent), lack of fruit and veg (4.7 per cent), alcohol (4.0 per cent), occupation (3.7 per cent) and sunlight (3.5 per cent). No other single factor, according to the report, is responsible for more than three per cent of cancers. Some oft-quoted examples like salt (0.5 per cent) and physical exercise (one per cent) have little effect at all. Even avoiding red meat altogether would only avoid 2.5 per cent of cancers, says the report.

November 16, 2011

The gender wage gap won’t go away

Filed under: Economics, Government, Politics — Tags: , , , — Nicholas @ 09:28

Kay Hymowitz explains that even with the best will in the world, the wage gap — often referred to as the 75-cents-on-the-dollar phenomenon — between men and women will persist:

Let’s begin by unpacking that 75-cent statistic, which actually varies from 75 to about 81, depending on the year and the study. The figure is based on the average earnings of full-time, year-round workers, usually defined as those who work 35 hours a week or more.

But consider the mischief contained in that “or more.” It makes the full-time category embrace everyone from a clerk who arrives at her desk at 9 a.m. and leaves promptly at 4 p.m. to a trial lawyer who eats dinner four nights a week — and lunch on weekends — at his desk.

I assume, in this case, that the clerk is a woman and the lawyer a man for the simple reason that — and here is an average that proofers rarely mention — full-time men work more hours than full-time women do. In 2007, according to the Bureau of Labor Statistics, 27 percent of male full-time workers had workweeks of 41 or more hours, compared with 15 percent of female full-time workers; just 4 percent of full-time men worked 35 to 39 hours a week, while 12 percent of women did. Since full-time men work more than full-time women do, it shouldn’t be surprising that the men, on average, earn more.

The other arena of mischief contained in the 75-cent statistic lies in the seemingly harmless term “occupation.” Everyone knows that a CEO makes more than a secretary and that a computer scientist makes more than a nurse. Most people wouldn’t be shocked to hear that secretaries and nurses are likely to be women, while CEOs and computer scientists are likely to be men. That explains much of the wage gap.

But proofers often make the claim that women earn less than men doing the exact same job. They can’t possibly know that. The Labor Department’s occupational categories can be so large that a woman could drive a truck through them. Among “physicians and surgeons,” for example, women make only 64.2 percent of what men make. Outrageous, right? Not if you consider that there are dozens of specialties in medicine: some, like cardiac surgery, require years of extra training, grueling hours, and life-and-death procedures; others, like pediatrics, are less demanding and consequently less highly rewarded. Only 16 percent of surgeons, but a full 50 percent of pediatricians, are women.

Don’t expect China to save your economy

Filed under: China, Economics, Government, Media — Tags: , , , , , — Nicholas @ 09:19

Jon, my former virtual landlord, sent along this link which should pour cold water on the notion that China will step in to save the economies of other countries:

China’s economy has a reputation for being strong and prosperous, but according to a well-known Chinese television personality the country’s Gross Domestic Product is going in reverse.

Larry Lang, chair professor of Finance at the Chinese University of Hong Kong, said in a lecture that he didn’t think was being recorded that the Chinese regime is in a serious economic crisis — on the brink of bankruptcy. In his memorable formulation: every province in China is Greece.

The restrictions Lang placed on the Oct. 22 speech in Shenyang City, in northern China’s Liaoning Province, included no audio or video recording, and no media. He can be heard saying that people should not post his speech online, or “everyone will look bad,” in the audio that is now on Youtube.

In the unusual, closed-door lecture, Lang gave a frank analysis of the Chinese economy and the censorship that is placed on intellectuals and public figures. “What I’m about to say is all true. But under this system, we are not allowed to speak the truth,” he said.

Despite Lang’s polished appearance on his high-profile TV shows, he said: “Don’t think that we are living in a peaceful time now. Actually the media cannot report anything at all. Those of us who do TV shows are so miserable and frustrated, because we cannot do any programs. As long as something is related to the government, we cannot report about it.”

China, for all its amazing growth and rising economic prospects for (some of) its population, is still not a modern economy. The government — specifically the military — is too deeply involved at far deeper levels than other governments and the reported economic figures may or may not have any relationship with reality. When your boss is a general, he has ways of ensuring that you report the “right” results that a civilian CEO cannot match. It’s not just your job you risk by reporting unwelcome results.

I’ve ridden this hobby horse, as Jon calls it, many times over the years.

October 31, 2011

QotD: Economics is not a “hard science”

Filed under: Economics, Quotations, Science — Tags: , , , — Nicholas @ 13:20

The problem at base is that economics is not a branch of mathematics or statistics, no matter how much economists wish it was. Never forget that the economics equations you see, the pretty graphs and charts, are just educated guesses that are wrong more often than not — economists love the gloss of the hard sciences, but the truth is that the field is firmly placed among the philosophical and sociological disciplines. Economics is a study of human behavior more than anything else, with all the uncertainties and confusion that entails.

“Monty”, “DOOM: I like that Doom Doom Pow”, Ace of Spades H.Q., 2011-10-31

« Newer PostsOlder Posts »

Powered by WordPress