Quotulatiousness

August 16, 2014

ESR on demilitarizing the police

Filed under: Law, Liberty, USA — Tags: , , , , , , — Nicholas @ 10:32

Eric S. Raymond is with most other libertarians about the problems with having your police become more like an occupying army:

I join my voice to those of Rand Paul and other prominent libertarians who are reacting to the violence in Ferguson, Mo. by calling for the demilitarization of the U.S.’s police. Beyond question, the local civil police in the U.S. are too heavily armed and in many places have developed an adversarial attitude towards the civilians they serve, one that makes police overreactions and civil violence almost inevitable.

But I publish this blog in part because I think it is my duty to speak taboo and unspeakable truths. And there’s another injustice being done here: the specific assumption, common among civil libertarians, that police overreactions are being driven by institutional racism. I believe this is dangerously untrue and actually impedes effective thinking about how to prevent future outrages.

There are some unwelcome statistics which at least partly explain why young black men are more likely to be stopped by the police:

… the percentage of black males 15-24 in the general population is about 1%. If you add “mixed”, which is reasonable in order to correspond to a policeman’s category of “nonwhite”, it goes to about 2%.

That 2% is responsible for almost all of 52% of U.S. homicides. Or, to put it differently, by these figures a young black or “mixed” male is roughly 26 times more likely to be a homicidal threat than a random person outside that category – older or younger blacks, whites, hispanics, females, whatever. If the young male is unambiguously black that figure goes up, about doubling.

26 times more likely. That’s a lot. It means that even given very forgiving assumptions about differential rates of conviction and other factors we probably still have a difference in propensity to homicide (and other violent crimes for which its rates are an index, including rape, armed robbery, and hot burglary) of around 20:1. That’s being very generous, assuming that cumulative errors have thrown my calculations are off by up to a factor of 6 in the direction unfavorable to my argument.

[…]

Yeah, by all means let’s demilitarize the police. But let’s also stop screaming “racism” when, by the numbers, the bad shit that goes down with black male youths reflects a cop’s rational fear of that particular demographic – and not racism against blacks in general. Often the cops in these incidents are themselves black, a fact that media accounts tend to suppress.

What we can actually do about the implied problem is a larger question. (Decriminalizing drugs would be a good start.) But it’s one we can’t even begin to address rationally without seeing past the accusation of racism.

July 31, 2014

NFL to test player tracking RFID system this year

Filed under: Football, Media, Technology — Tags: , , — Nicholas @ 07:01

Tom Pelissero talks about the new system which will be installed at 17 NFL stadiums this season:

The NFL partnered with Zebra Technologies, which is applying the same radio-frequency identification (RFID) technology that it has used the past 15 years to monitor everything from supplies on automotive assembly lines to dairy cows’ milk production.

Work is underway to install receivers in 17 NFL stadiums, each connected with cables to a hub and server that logs players’ locations in real time. In less than a second, the server can spit out data that can be enhanced graphically for TV broadcasts with the press of a button.

[…]

TV networks have experimented in recent years with route maps and other visual enhancements of players’ movements. But league-wide deployment of the sensors and all the data they produce could be the most significant innovation since the yellow first-down line.

The data also will go to the NFL “cloud,” where it can be turned around in seconds for in-stadium use and, eventually, a variety of apps and other visual and second-screen experiences. Producing a set of proprietary statistics on players and teams is another goal, Shah said.

NFL teams — many already using GPS technology to track players’ movements, workload and efficiency in practice — won’t have access to the in-game information in 2014 because of competitive considerations while the league measures the sustainability and integrity of the data.

“But as you imagine, longer-term, that is the vision,” Shah said. “Ultimately, we’re going to have a whole bunch of location-based data that’s coming out of live-game environment, and we want teams to be able to marry that up to what they’re doing in practice facilities themselves.”

Zebra’s sensors are oblong, less than the circumference of a quarter and installed under the top cup of the shoulder pad, Stelfox said. They blink with a signal 25 times a second and run on a watch battery. The San Francisco 49ers and Detroit Lions and their opponents wore them for each of the two teams home games in last season as part of a trial run.

About 20 receivers will be placed around the bands between the upper and lower decks of the 17 stadiums that were selected for use this year. They’ll provide a cross-section of environments and make sure the technology is operational across competitive settings before full deployment.

July 23, 2014

In statistical studies, the size of the data sample matters

Filed under: Food, Health, Science, USA — Tags: , , , , — Nicholas @ 08:49

In the ongoing investigation into why Westerners — especially North Americans — became obese, some of the early studies are being reconsidered. For example, I’ve mentioned the name of Dr. Ancel Keys a couple of times recently: he was the champion of the low-fat diet and his work was highly influential in persuading government health authorities to demonize fat in pursuit of better health outcomes. He was so successful as an advocate for this idea that his study became one of the most frequently cited in medical science. A brilliant success … that unfortunately flew far ahead of its statistical evidence:

So Keys had food records, although that coding and summarizing part sounds a little fishy. Then he followed the health of 13,000 men so he could find associations between diet and heart disease. So we can assume he had dietary records for all 13,000 of them, right?

Uh … no. That wouldn’t be the case.

The poster-boys for his hypothesis about dietary fat and heart disease were the men from the Greek island of Crete. They supposedly ate the diet Keys recommended: low-fat, olive oil instead of saturated animal fats and all that, you see. Keys tracked more than 300 middle-aged men from Crete as part of his study population, and lo and behold, few of them suffered heart attacks. Hypothesis supported, case closed.

So guess how many of those 300-plus men were actually surveyed about their eating habits? Go on, guess. I’ll wait …

And the answer is: 31.

Yup, 31. And that’s about the size of the dataset from each of the seven countries: somewhere between 25 and 50 men. It’s right there in the paper’s data tables. That’s a ridiculously small number of men to survey if the goal is to accurately compare diets and heart disease in seven countries.

[…]

Getting the picture? Keys followed the health of more than 300 men from Crete. But he only surveyed 31 of them, with one of those surveys taken during the meat-abstinence month of Lent. Oh, and the original seven-day food-recall records weren’t available later, so he swapped in data from an earlier paper. Then to determine fruit and vegetable intake, he used data sheets about food availability in Greece during a four-year period.

And from this mess, he concluded that high-fat diets cause heart attacks and low-fat diets prevent them.

Keep in mind, this is one of the most-cited studies in all of medical science. It’s one of the pillars of the Diet-Heart hypothesis. It helped to convince the USDA, the AHA, doctors, nutritionists, media health writers, your parents, etc., that saturated fat clogs our arteries and kills us, so we all need to be on low-fat diets – even kids.

Yup, Ancel Keys had a tiny one … but he sure managed to screw a lot of people with it.

H/T to Amy Alkon for the link.

July 22, 2014

23% of US children live in poverty … except that’s not actually true

Filed under: Government, USA — Tags: , , — Nicholas @ 07:48

In Forbes, Tim Worstall explains why the shocking headline rate of child poverty in the US is not correct (and that’s a good thing):

The annual Kids Count, from the Annie F. Casey Foundation, is out and many are reporting that it shows that 23% of American children are living in poverty. I’m afraid that this isn’t quite true and the mistaken assumption depends on one little intricate detail of how US poverty statistics are constructed. This isn’t a snarl at Kids Count, they report the numbers impartially, it’s the interpretation that some are putting on those numbers that is in error. For the reality is that, by the way that the US measures poverty, it does a pretty good job in alleviating child poverty. The real rate of children actually living in poverty, after all the aid they get to not live in poverty, is more like 2 or 3% of US children. Which is pretty good for government work.

[…]

However, this is not the same thing as stating that 23% of US children are living in poverty. For there’s a twist in the way that US poverty statistics are compiled.

Everyone else measures poverty as being below 60% of median equivalised household disposable income. This is a measure of relative poverty, how much less do you have than the average? The US uses a different measure, based upon historical accident really, which is a measure of absolute poverty. How may people have less than $x to live upon? There’s also a second difference. Everyone else measures poverty after the influence of the tax and the benefits system upon those incomes. The US measures only cash income (both market income and also cash from the government). It does not measure the influence of benefits that people receive in kind (ie, in goods or services) nor through the tax system. And the problem with this is that the major poverty alleviation schemes in the US are, in rough order, Medicaid, the EITC, SNAP (or food stamps) and then Section 8 housing vouchers. Three of which are goods or services in kind and the fourth comes through the tax system.

July 21, 2014

The science of ballistics, the art of war, and the birth of the assault rifle

Filed under: History, Military, Technology, Weapons — Tags: , , , — Nicholas @ 15:47

Defence With A “C” summarizes the tale of how we got to the current suite of modern military small arms. It’s a long story, but if you’re interested in firearms, it’s a fascinating one.

To understand why we’ve arrived where we are now with the NATO standard 5.56mm calibre round you have to go all the way back to the war of 1939-1945. Much study of this conflict would later inform decision making surrounding the adoption of the 5.56, but for now there was one major change that took place which would set the course for the future.

The German Sturmgewehr 44 is widely accepted as the worlds first true assault rifle. Combining the ability to hit targets out to around 500 yards with individual shots in a semi-automatic mode, as well as the ability to fire rapidly in fully automatic mode (almost 600 rounds per minute) the StG 44 represented a bridge between short ranged sub-machine guns and longer ranged bolt action rifles.

[…]

After the second world war the US army began conducting research to help it learn the lessons of its previous campaigns, as well as preparing it for potential future threats. As part of this effort it began to contract the services of the Operations Research Office (ORO) of the John Hopkins University in Baltimore, Maryland, for help in conducting the scientific analysis of various aspects of ground warfare.

On October 1st, 1948, the ORO began Project ALCLAD, a study into the means of protecting soldiers from the “casualty producing hazards of warfare“. In order to determine how best to protect soldiers from harm, it was first necessary to investigate the major causes of casualties in war.

After studying large quantities of combat and casualty reports, ALCLAD concluded that first and foremost the main danger to combat soldiers was from high explosive weapons such as artillery shells, fragments from which accounted for the vast majority of combat casualties. It also determined that casualties inflicted by small arms fire were essentially random.

Allied troops in WW2 had been generally armed with full-sized bolt action rifles (while US troops were being issued the M1 Garand), optimized to be accurate out to 600 yards or more, yet most actual combat was at much shorter ranges than that. Accuracy is directly affected by the stress, tension, distraction, and all-around confusion of the battlefield: even at such short ranges, riflemen required many shots to be expended in hopes of inflicting a hit on an enemy. The ORO ran a series of tests to simulate battle conditions for both expert and ordinary riflemen and found some unexpected results:

A number of significant conclusions were thus drawn from these tests. Firstly, that accuracy — even for prone riflemen, some of them expert shots, shooting at large static targets — was poor beyond ranges of about 250 yards. Secondly, that under simulated conditions of combat shooting an expert level marksman was no more accurate than a regular shot. And finally that the capabilities of the individual shooters were far below the potential of the rifle itself.

This in turn — along with the analysis of missed shots caught by a screen behind the targets — led to three further conclusions.

First, that any effort to try and make the infantry’s general purpose weapon more accurate (such as expensive barrels) was largely a waste of time and money. The weapon was, and probably always would be, inherently capable of shooting much tighter groups than the human behind it.

Second, that there was a practical limit to the value of marksmanship training for regular infantry soldiers. Beyond a certain basic level of training any additional hours were of limited value*, and the number of hours required to achieve a high level of proficiency would be prohibitive. This was particularly of interest for planning in the event of another mass mobilisation for war.

July 15, 2014

The attraction (and danger) of computer-based models

Filed under: Environment, Science, Technology — Tags: , , — Nicholas @ 00:02

Warren Meyer explains why computer models can be incredibly useful tools, but they are not the same thing as an actual proof:

    Among the objections, including one from Green Party politician Chit Chong, were that Lawson’s views were not supported by evidence from computer modeling.

I see this all the time. A lot of things astound me in the climate debate, but perhaps the most astounding has been to be accused of being “anti-science” by people who have such a poor grasp of the scientific process.

Computer models and their output are not evidence of anything. Computer models are extremely useful when we have hypotheses about complex, multi-variable systems. It may not be immediately obvious how to test these hypotheses, so computer models can take these hypothesized formulas and generate predicted values of measurable variables that can then be used to compare to actual physical observations.

[…]

The other problem with computer models, besides the fact that they are not and cannot constitute evidence in and of themselves, is that their results are often sensitive to small changes in tuning or setting of variables, and that these decisions about tuning are often totally opaque to outsiders.

I did computer modelling for years, though of markets and economics rather than climate. But the techniques are substantially the same. And the pitfalls.

Confession time. In my very early days as a consultant, I did something I am not proud of. I was responsible for a complex market model based on a lot of market research and customer service data. Less than a day before the big presentation, and with all the charts and conclusions made, I found a mistake that skewed the results. In later years I would have the moral courage and confidence to cry foul and halt the process, but at the time I ended up tweaking a few key variables to make the model continue to spit out results consistent with our conclusion. It is embarrassing enough I have trouble writing this for public consumption 25 years later.

But it was so easy. A few tweaks to assumptions and I could get the answer I wanted. And no one would ever know. Someone could stare at the model for an hour and not recognize the tuning.

July 8, 2014

The trend that isn’t actually trending

Filed under: Media, USA — Tags: , , , — Nicholas @ 10:04

At Coyote Blog, Warren Meyer debunks one of the most frequently reported “trends” of the last few years:

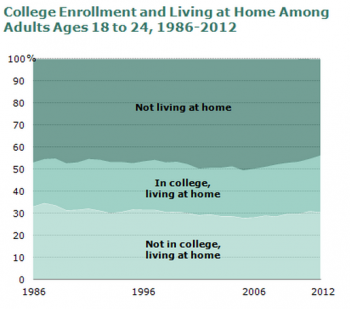
Not a trend -living at home

It turns out that the share of young people 18-24 not in college but living at home has actually fallen. Any surge in young adults living at home is all from college kids, due to this odd definition the Census uses

    It is important to note that the Current Population Survey counts students living in dormitories as living in their parents’ home.

Campus housing, for some reason, counts in the census as living at home with your parents. And since college attendance is growing, thus you get this trend that is not a trend.

June 30, 2014

Has your Facebook feed been particularly “down” lately?

Filed under: Media, Technology — Tags: , , — Nicholas @ 08:42

If so, you may have been involuntarily recruited to take part in a “scientific” study as Facebook tailored hundreds of thousands of users’ feeds to show them only good news or only bad news:

As you may have heard (since it appears to have become the hyped up internet story of the weekend), the Proceedings of the National Academy of Sciences (PNAS) recently published a study done by Facebook, with an assist from researchers at UCSF and Cornell, in which they directly tried (and apparently succeeded) to manipulate the emotions of 689,003 users of Facebook for a week. The participants — without realizing they were a part of the study — had their news feeds “manipulated” so that they showed all good news or all bad news. The idea was to see if this made the users themselves feel good or bad. Contradicting some other research which found that looking at photos of your happy friends made you sad, this research apparently found that happy stuff in your feed makes you happy. But, what’s got a lot of people up in arms is the other side of that coin: seeing a lot of negative stories in your feed, appears to make people mad.

There are, of course, many different ways to view this: and the immediate response from many is “damn, that’s creepy.”

Did you know that your terms of service with Facebook allow this? I suspect a lot of Facebook users had no clue that their newsfeeds could be (and regularly are) manipulated without their awareness and consent.

If anything, what I think this does is really to highlight how much Facebook manipulates the newsfeed. This is something very few people seem to think about or consider. Facebook‘s newsfeed system has always been something of a black box (which is a reason that I prefer Twitter‘s setup where you get the self-chosen firehose, rather than some algorithm (or researchers’ decisions) picking what I get to see). And, thus, in the end, while Facebook may have failed to get the level of “informed consent” necessary for such a study, it may have, in turn, done a much better job accidentally “informing” a lot more people how its newsfeeds get manipulated. Whether or not that leads more people to rely on Facebook less, well, perhaps that will be the subject of a future study…

Related: Brendan posted this the other day, and I found it quite amusing.

June 29, 2014

Maclean’s puts Canada on the map, sorta

Filed under: Cancon — Tags: , — Nicholas @ 11:39

For Canada Day, Maclean’s tries portraying the country in various different ways:

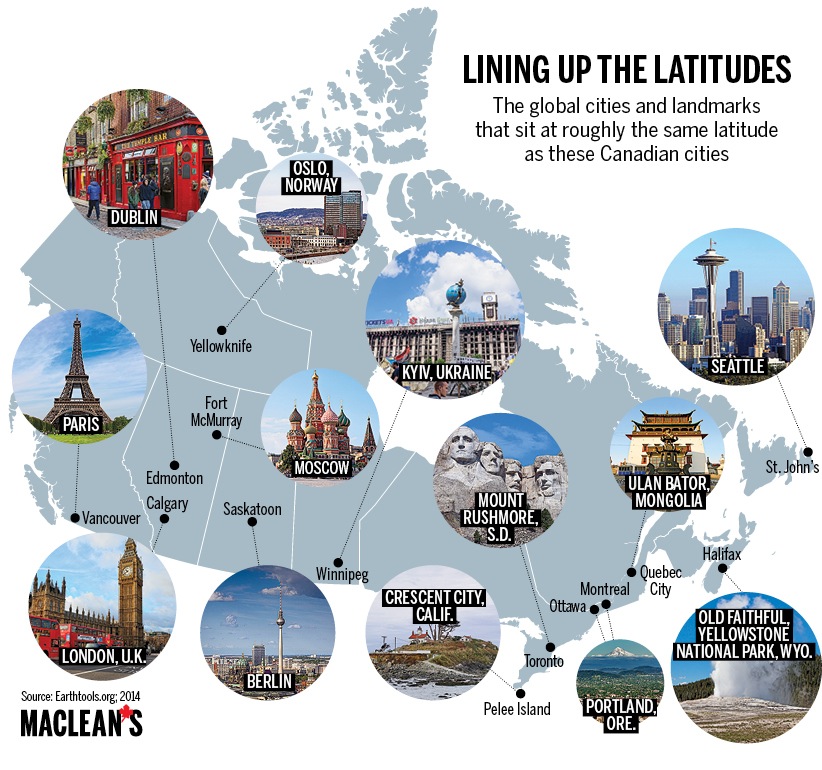
Happy Canada Day! For a different perspective on the country this year, Maclean’s went to the maps. Drawing on a variety of sources, from government statistics to various online databases to tweets, here are some maps to illustrate Canada as you’ve never seen it before.

[…]

It’s always a surprise when people first learn that the very tip of southwestern Ontario is at a lower latitude than parts of California — which got us wondering: How do other parts of the country line up with the rest of the world? Here are the results, using Earthtools.org. Most of the cities on this map, and their global counterparts, lie within less than 50 km of each other, latitudinally speaking, of course. Only Quebec-Ulan Bator and Fort McMurray-Moscow are a full degree apart.

Canadian cities and other cities by latitude

[…]

What to say? Canada is a land of contrasts. It also offers up a bounty of clichés.

Canadian provinces by clichés

May 9, 2014

QotD: Real history and economic modelling

Filed under: Economics, History, Media, Quotations — Tags: , , — Nicholas @ 08:23

I am not an economist. I am an economic historian. The economist seeks to simplify the world into mathematical models — in Krugman’s case models erected upon the intellectual foundations laid by John Maynard Keynes. But to the historian, who is trained to study the world “as it actually is”, the economist’s model, with its smooth curves on two axes, looks like an oversimplification. The historian’s world is a complex system, full of non-linear relationships, feedback loops and tipping points. There is more chaos than simple causation. There is more uncertainty than calculable risk. For that reason, there is simply no way that anyone — even Paul Krugman — can consistently make accurate predictions about the future. There is, indeed, no such thing as the future, just plausible futures, to which we can only attach rough probabilities. This is a caveat I would like ideally to attach to all forward-looking conjectural statements that I make. It is the reason I do not expect always to be right. Indeed, I expect often to be wrong. Success is about having the judgment and luck to be right more often than you are wrong.

Niall Ferguson, “Why Paul Krugman should never be taken seriously again”, The Spectator, 2013-10-13

May 4, 2014

Quarterback boom or bust metrics

Filed under: Football — Tags: , , — Nicholas @ 11:31

At the Daily Norseman, CCNorseman has been working on developing a set of metrics for determining the chances of NFL success for prospective draft picks at the quarterback position:

This past off-season I have been scouring current and past scouting reports to try to develop a metric that we can use to evaluate quarterback prospects. I started by developing a metric to evaluate the traits of successful quarterbacks. I cataloged the traits found in pre-draft scouting reports of an elite list of 25 successful quarterbacks that have been drafted since 1998, and based the metric on those traits that were most common among that pool of players. In other words, I attempted to answer the question, “What common traits did the most successful quarterbacks in the NFL have coming out of college?” Then I went back and re-evaluated the “success metric” based on excellent feedback from the readers here at the Daily Norseman. I also developed a second metric to evaluate the traits of quarterback busts. It was the same process, except that I catalogued the common traits of the 17 quarterback busts since 1998 and based the bust metric on those traits that were most common among those players. That led me to the final Boom or Bust metric, which you can also find in that second link (and is listed below). The last step in this process is what you’ll find here: verifying the accuracy of the metric. I have gone back and run the metric on quarterbacks drafted in the 1st round of past drafts to see how successful it would have been at predicting the future successes of those players. The short of it is: it’s more accurate than a random guess. It’s not fool-proof mind you, but over the course of seven drafts from 2004 through 2010, it would have accurately predicted which 1st round quarterbacks would bust and which would be serviceable or better 73% of the time. Why did I only go back to 2004? Well, I really wanted to use at least two scouting reports for every quarterback when testing the metric to ensure better accuracy, but the farther back in time I went, the harder and harder it was to find reliable scouting reports online. I wasn’t able to track down more than one reliable scouting report for the quarterbacks drafted in 2003 and earlier, so there really is no other reason than that. I stopped at 2010, because a quarterback needs at least 4 years in the league to qualify as a bust or not, and those quarterbacks drafted in 2011 and later haven’t had a full 4 years yet.

[…]

It’s worth pointing out that in this particular data set (2004-2010), the Bust Metric by itself was almost as accurate overall as the combined metric in predicting the future of these quarterbacks and was 68% accurate by itself (although they each had slightly different results on a per quarterback basis). The success metric by itself was a little less accurate, correctly predicting the future only 61% of the time. In any case listed below are the 19 first round quarterbacks drafted between 2004 and 2010, with their metric scores from their pre-draft scouting reports and pre-draft prediction. I have taken some leeway in assigning the outcome score to this. My biggest concern in all of this is to ensure that if the metric predicts the quarterback to be in the bust category that they truly are a bust. After that, we can end up splitting hairs all day about what makes a quarterback “average” or “successful” or not. In other words, if the metric predicts that a quarterback will be merely league average, but he turns out to be a successful one then I’ll still call it a win for the metric, because it didn’t predict that quarterback to bust. I think teams are mostly concerned with not having their 1st round quarterback bust (like JaMarcus Russell or Ryan Leaf), than whether or not they get a Jason Campbell versus Aaron Rodgers type. I have given each quarterback an outcome label of “yes”, “maybe” or “no”. A “maybe” label essentially means that the player has performed reasonably well, but still has enough time left in their career to qualify for their prediction label. In those cases, the quarterback receives half-credit for their outcome.

May 3, 2014

Fat’s negative health impact reconsidered

Filed under: Food, Health, Science — Tags: , , , — Nicholas @ 09:19

Hmm. Today seems to be health news day. In the Wall Street Journal, Nina Teicholz looks at the dubious science behind the saturated fat demonization we’ve all seen in so many health stories:

“Saturated fat does not cause heart disease” — or so concluded a big study published in March in the journal Annals of Internal Medicine. How could this be? The very cornerstone of dietary advice for generations has been that the saturated fats in butter, cheese and red meat should be avoided because they clog our arteries. For many diet-conscious Americans, it is simply second nature to opt for chicken over sirloin, canola oil over butter.

The new study’s conclusion shouldn’t surprise anyone familiar with modern nutritional science, however. The fact is, there has never been solid evidence for the idea that these fats cause disease. We only believe this to be the case because nutrition policy has been derailed over the past half-century by a mixture of personal ambition, bad science, politics and bias.

Our distrust of saturated fat can be traced back to the 1950s, to a man named Ancel Benjamin Keys, a scientist at the University of Minnesota. Dr. Keys was formidably persuasive and, through sheer force of will, rose to the top of the nutrition world — even gracing the cover of Time magazine — for relentlessly championing the idea that saturated fats raise cholesterol and, as a result, cause heart attacks.

[…]

Critics have pointed out that Dr. Keys violated several basic scientific norms in his study. For one, he didn’t choose countries randomly but instead selected only those likely to prove his beliefs, including Yugoslavia, Finland and Italy. Excluded were France, land of the famously healthy omelet eater, as well as other countries where people consumed a lot of fat yet didn’t suffer from high rates of heart disease, such as Switzerland, Sweden and West Germany. The study’s star subjects — upon whom much of our current understanding of the Mediterranean diet is based — were peasants from Crete, islanders who tilled their fields well into old age and who appeared to eat very little meat or cheese.

As it turns out, Dr. Keys visited Crete during an unrepresentative period of extreme hardship after World War II. Furthermore, he made the mistake of measuring the islanders’ diet partly during Lent, when they were forgoing meat and cheese. Dr. Keys therefore undercounted their consumption of saturated fat. Also, due to problems with the surveys, he ended up relying on data from just a few dozen men — far from the representative sample of 655 that he had initially selected. These flaws weren’t revealed until much later, in a 2002 paper by scientists investigating the work on Crete — but by then, the misimpression left by his erroneous data had become international dogma.

April 7, 2014

Big data’s promises and limitations

Filed under: Economics, Science, Technology — Tags: , — Nicholas @ 07:06

In the New York Times, Gary Marcus and Ernest Davis examine the big claims being made for the big data revolution:

Is big data really all it’s cracked up to be? There is no doubt that big data is a valuable tool that has already had a critical impact in certain areas. For instance, almost every successful artificial intelligence computer program in the last 20 years, from Google’s search engine to the I.B.M. Jeopardy! champion Watson, has involved the substantial crunching of large bodies of data. But precisely because of its newfound popularity and growing use, we need to be levelheaded about what big data can — and can’t — do.

The first thing to note is that although big data is very good at detecting correlations, especially subtle correlations that an analysis of smaller data sets might miss, it never tells us which correlations are meaningful. A big data analysis might reveal, for instance, that from 2006 to 2011 the United States murder rate was well correlated with the market share of Internet Explorer: Both went down sharply. But it’s hard to imagine there is any causal relationship between the two. Likewise, from 1998 to 2007 the number of new cases of autism diagnosed was extremely well correlated with sales of organic food (both went up sharply), but identifying the correlation won’t by itself tell us whether diet has anything to do with autism.

Second, big data can work well as an adjunct to scientific inquiry but rarely succeeds as a wholesale replacement. Molecular biologists, for example, would very much like to be able to infer the three-dimensional structure of proteins from their underlying DNA sequence, and scientists working on the problem use big data as one tool among many. But no scientist thinks you can solve this problem by crunching data alone, no matter how powerful the statistical analysis; you will always need to start with an analysis that relies on an understanding of physics and biochemistry.

March 29, 2014

Nate Silver … in the shark tank

Filed under: Environment, Media — Tags: , , , — Nicholas @ 10:24

Statistician-to-the-stars Nate Silver can shrug off attacks from Republicans over his 2012 electoral forecast or from Democrats unhappy with his latest forecast for the 2014 mid-terms, but he’s finding himself under attack from an unexpected quarter right now:

Ever wondered how it would feel to be dropped from a helicopter into a swirling mass of crazed, genetically modified oceanic whitetip sharks in the middle of a USS-Indianapolis-style feeding frenzy?

Just ask Nate Silver. He’s been living the nightmare all week – ever since he had the temerity to appoint a half-way skeptical scientist as resident climate expert at his “data-driven” journalism site, FiveThirtyEight.

Silver has confessed to The Daily Show that he can handle the attacks from Paul Krugman (“frivolous”), from his ex-New York Times colleagues, and from Democrats disappointed with his Senate forecasts. But what has truly spooked this otherwise fearless seeker-after-truth, apparently, is the self-righteous rage from the True Believers in Al Gore’s Church of Climate Change.

“We don’t pay that much attention to what media critics say, but that was a piece where we had 80 percent of our commenters weigh in negatively, so we’re commissioning a rebuttal to that piece,” said Silver. “We listen to the people who actually give us legs.”

The piece in question was the debut by his resident climate expert, Roger Pielke, Jr., arguing that there was no evidence to support claims by alarmists that “extreme weather events” are on the increase and doing more damage than ever before. Pielke himself is a “luke-warmer” – that is, he believes that mankind is contributing to global warming but is not yet convinced that this contribution will be catastrophic. But neither his scientific bona fides (he was Director of the Center for Science and Technology Policy Research at the University of Colorado Boulder) nor his measured, fact-based delivery were enough to satisfy the ravening green-lust of FiveThirtyEight’s mainly liberal readership.

March 28, 2014

Opinions, statistics, and sex work

Filed under: Law, Liberty, Media — Tags: , , , — Nicholas @ 09:04

Maggie McNeill explains why the “sex trafficking” meme has been so relentlessly pushed in the media for the last few years:

Imagine a study of the alcohol industry which interviewed not a single brewer, wine expert, liquor store owner or drinker, but instead relied solely on the statements of ATF agents, dry-county politicians and members of Alcoholics Anonymous and Mothers Against Drunk Driving. Or how about a report on restaurants which treated the opinions of failed hot dog stand operators as the basis for broad statements about every kind of food business from convenience stores to food trucks to McDonald’s to five-star restaurants?

You’d probably surmise that this sort of research would be biased and one-sided to the point of unreliable. And you’d be correct. But change the topic to sex work, and such methods are not only the norm, they’re accepted uncritically by the media and the majority of those who the resulting studies. In fact, many of those who represent themselves as sex work researchers don’t even try to get good data. They simply present their opinions as fact, occasionally bolstered by pseudo-studies designed to produce pre-determined results. Well-known and easily-contacted sex workers are rarely consulted. There’s no peer review. And when sex workers are consulted at all, they’re recruited from jails and substance abuse programs, resulting in a sample skewed heavily toward the desperate, the disadvantaged and the marginalized.

This sort of statistical malpractice has always been typical of prostitution research. But the incentive to produce it has dramatically increased in the past decade, thanks to a media-fueled moral panic over sex trafficking. Sex-work prohibitionists have long seen trafficking and sex slavery as a useful Trojan horse. In its 2010 “national action plan,” for example, the activist group Demand Abolition writes,“Framing the Campaign’s key target as sexual slavery might garner more support and less resistance, while framing the Campaign as combating prostitution may be less likely to mobilize similar levels of support and to stimulate stronger opposition.”

« Newer PostsOlder Posts »

Powered by WordPress