
Extra Credits
Published on 30 Jun 2018You gently corrected out our math mistakes and artistic slip-ups, and we’re here to tell you it was all part of Bismarck’s plans—er, it’s Euclid’s fault. Time for another episode of Lies!
July 2, 2018
History of Non-Euclidean Geometry – Lies – Extra History – #6
Comments Off on History of Non-Euclidean Geometry – Lies – Extra History – #6
June 25, 2018
The History of Non-Euclidian Geometry – The World We Know – Extra History – #5
Extra Credits
Published on 23 Jun 2018Up until the 20th century, people assumed light behaved like a wave, passing through the “aether wind” — a fluid with incomprehensible properties. When the Michelson-Morley experiment disproved the aether’s existence, Einstein put out the theory of relativity — that space and time were part of the same package.
It’s 1887. Physics is almost complete. We almost know enough to see the clockwork of the universe. Only one last great question remains: how does light travel?
Comments Off on The History of Non-Euclidian Geometry – The World We Know – Extra History – #5
June 19, 2018
The History of Non-Euclidian Geometry – A Most Terrible Possibility – Extra History – #4
Extra Credits
Published on 16 Jun 2018In the early 19th century, people started to wonder if the Fifth Postulate couldn’t be proven at all — meaning that it could be right, but it could also be wrong. Bolyai, Lobachevsky, and Riemann started exploring hyperbolic geometry and other strange realms…
Comments Off on The History of Non-Euclidian Geometry – A Most Terrible Possibility – Extra History – #4
June 11, 2018
The History of Non-Euclidian Geometry – Squaring the Circle – Extra History – #3
Extra Credits
Published on 9 Jun 2018Euclidean geometry eventually found its way back into Europe, inspiring René Descartes to create the Cartesian coordinate system for maps, and Isaac Newton to invent calculus. Both these tools helped humanity understand the world better.
Comments Off on The History of Non-Euclidian Geometry – Squaring the Circle – Extra History – #3
June 4, 2018
The History of Non-Euclidian Geometry – The Great Quest – Extra History – #2
Extra Credits
Published on 2 Jun 2018For hundreds of years, Euclid’s geometry disappeared with the fall of the Roman Empire. But in Constantinople, Islamic mathematicians, including Al-Khwarizmi (who gave us the word “algebra”) worked long and hard on proving the Fifth Postulate.
Comments Off on The History of Non-Euclidian Geometry – The Great Quest – Extra History – #2
May 29, 2018
The History of Non-Euclidian Geometry – Sacred Geometry – Extra History – #1
Extra Credits
Published on 26 May 2018Before we get into non-Euclidian geometry, we have to know: what even is geometry? What’s up with the Pythagorean math cult? Who was Euclid, for that matter? And what the heck is the 5th Postulate?
Comments Off on The History of Non-Euclidian Geometry – Sacred Geometry – Extra History – #1
August 5, 2017
What are binary numbers? – James May’s Q&A (Ep 11100) – Head Squeeze
Published on 5 Jul 2013
James May asks “What are binary numbers, and why does my computer need them?
Watch James getting confused here: http://youtu.be/8Kjf5x-1-_s
Binary: http://mathworld.wolfram.com/Binary.html
Counting in base 10: http://mae.ucdavis.edu/dsouza/Classes/ECS15-W13/counting.pdf
Comments Off on What are binary numbers? – James May’s Q&A (Ep 11100) – Head Squeeze
May 1, 2017
Math is hard … and in Oregon it can lead to hard time
Did you know that you have to be certified by an Oregon regulatory agency to do certain kinds of math? Mats Järlström has discovered just how draconian the state can be about unauthorized mathematizing:
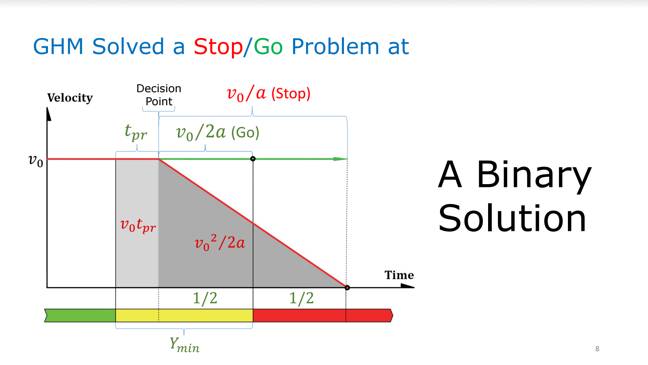
After exploring the math behind traffic light timing, Järlström concluded that the formula, created in 1959, accounted for only two yellow light scenarios: driving straight through the intersection, or stopping.
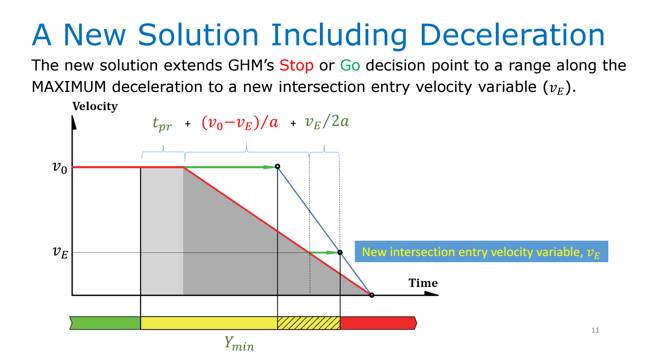
So Järlström decided to try to improve the math managing the transition time from yellow to red, in order to allow a driver traveling through an intersection with a yellow light to slow down and turn without being flagged for a red light violation. And in early 2015 he shared his proposal with the media, policymakers, and those interested in the traffic technology.
“It’s not rocket science,” Järlström said in a phone interview with The Register. “It took me about 40 minutes to figure it out.”
For communicating his findings in five emails, the Oregon State Board of Examiners for Engineering and Land Surveying in March, 2015 opened an investigation. In August 2016, the rules body found [PDF] that Järlström had engaged in unlicensed engineering and assessed a $500 fine.
Even better, if he persists, he may even face jail time for his unlicensed mathematical crime spree.
Järlström paid the fine but fears his ongoing interest in traffic light timing will lead to further penalties. Violating the Act could subject him to $1,000 in civil penalties, $6,250 in criminal fines, and as much as a year in jail.
Comments Off on Math is hard … and in Oregon it can lead to hard time
February 13, 2017
“[M]ost of what journalists know about radioactivity came from watching Godzilla“
Charlie Martin explains why the “news” out of Fukushima lately has been mostly unscientific hyperventilation and bloviation:
On February 8, Adam Housley of Fox News reported a story with a terrifying headline: “Radiation at Japan’s Fukushima Reactor Is Now at ‘Unimaginable’ Levels.” Let’s just pick up the most exciting paragraphs:
The radiation levels at Japan’s crippled Fukushima nuclear power plant are now at “unimaginable” levels.
[Housley] said the radiation levels — as high as 530 sieverts per hour — are now the highest they’ve been since 2011 when a tsunami hit the coastal reactor.
“To put this in very simple terms. Four sieverts can kill a handful of people,” he explained.
The degree to which this story is misleading is amazing, but to explain it, we need a little bit of a tutorial.
The Touhoku earthquake and tsunami on March 11, 2011, along with all the other damage they caused, knocked out the TEPCO Fukushima Daiichi (“plant #1”) and Daini (“plant #2”) reactors. Basically, the two reactors were hit with a 1000-year earthquake and a 1000-year tsunami, and the plants as built weren’t able to handle it.
Both reactors failed, and after a sequence of unfortunate events, melted down. I wrote quite a lot about it at the time; bearing in mind this was early in the story, my article from then has a lot of useful information.
[…]
So what have we learned today?
We learned that inside the reactor containment at Fukushima Daini, site of the post-tsunami reactor accident, it’s very very radioactive. How radioactive? We don’t know, because the dose rate has been reported in inappropriate units — Sieverts are only meaningful if someone is inside the reactor to get dosed.
Then we learned that the Fukushima accident is leaking 300 tons of radioactive water — but until we dig into primary sources, we didn’t learn the radioactive water is very nearly clean enough to be drinking water. So what effect does this have on the ocean, as Housley asks? None.
The third thing we learned — and I think probably the most important thing — is to never trust a journalist writing about anything involving radiation, the metric system, or any arithmetic more challenging than long division.
Comments Off on “[M]ost of what journalists know about radioactivity came from watching Godzilla“
December 9, 2016
The Trudeau government’s bad times
Chris Selley on the (largely self-inflicted) hard times of Justin Trudeau’s government recently:
It has been one hell of a couple of weeks for the Liberal Party of Canada: first Prime Minister Justin Trudeau’s bizarre encomium to dearly departed Fidel; then the approval of two pipelines projects, dashing the oil-free dreams of people who hadn’t been paying attention and producing thousands of barrels of fake outrage; and then, the inevitable collapse of the government’s electoral reform agenda.
It was always going to look bad. The Liberals were always going to break their promise to make 2015 the last first-past-the-post election. Perhaps they had even contemplated their members on the electoral reform committee recommending they break it, by adopting a go-slower approach. But no one, surely, anticipated Democratic Institutions Minister Maryam Monsef accusing the committee as a whole of not doing the job she had set out for them, which they had; mocking the Gallagher Index, an easily explicable formula for measuring proportionality in election results; and justifying herself with shameless bafflegab that would make Paul Calandra blush.
[…]
Monsef later apologized for accusing committee members of slacking, Manon Cornellier notes in Le Devoir, but not for misrepresenting their mandate, mocking mathematics — as an emissary of the party of “evidence-based policy,” no less — and generally behaving like a buffoon.
“(Monsef’s) beef with the Gallagher Index isn’t that it only measures proportionality. Her beef with the Gallagher Index is that it’s math, with its sums of squares and square roots and symbols that are literally Greek,” Fine fumes. It’s a worrying outburst of idiocy, she argues. Monsef and her ilk talk constantly of “engagement,” but that’s a very difficult thing to measure. “At the intersection of ‘affinity for engagement’ and ‘contempt for metrics’ is fertile breeding ground for leaders who wish to make up their own rules,” Fine trenchantly observes.
Comments Off on The Trudeau government’s bad times
October 29, 2016
QotD: IQ and different types of intelligence
My last IQ-ish test was my SATs in high school. I got a perfect score in Verbal, and a good-but-not-great score in Math.
And in high school English, I got A++s in all my classes, Principal’s Gold Medals, 100%s on tests, first prize in various state-wide essay contests, etc. In Math, I just barely by the skin of my teeth scraped together a pass in Calculus with a C-.
Every time I won some kind of prize in English my parents would praise me and say I was good and should feel good. My teachers would hold me up as an example and say other kids should try to be more like me. Meanwhile, when I would bring home a report card with a C- in math, my parents would have concerned faces and tell me they were disappointed and I wasn’t living up to my potential and I needed to work harder et cetera.
And I don’t know which part bothered me more.
Every time I was held up as an example in English class, I wanted to crawl under a rock and die. I didn’t do it! I didn’t study at all, half the time I did the homework in the car on the way to school, those essays for the statewide competition were thrown together on a lark without a trace of real effort. To praise me for any of it seemed and still seems utterly unjust.
On the other hand, to this day I believe I deserve a fricking statue for getting a C- in Calculus I. It should be in the center of the schoolyard, and have a plaque saying something like “Scott Alexander, who by making a herculean effort managed to pass Calculus I, even though they kept throwing random things after the little curly S sign and pretending it made sense.”
And without some notion of innate ability, I don’t know what to do with this experience. I don’t want to have to accept the blame for being a lazy person who just didn’t try hard enough in Math. But I really don’t want to have to accept the credit for being a virtuous and studious English student who worked harder than his peers. I know there were people who worked harder than I did in English, who poured their heart and soul into that course – and who still got Cs and Ds. To deny innate ability is to devalue their efforts and sacrifice, while simultaneously giving me credit I don’t deserve.
Meanwhile, there were some students who did better than I did in Math with seemingly zero effort. I didn’t begrudge those students. But if they’d started trying to say they had exactly the same level of innate ability as I did, and the only difference was they were trying while I was slacking off, then I sure as hell would have begrudged them. Especially if I knew they were lazing around on the beach while I was poring over a textbook.
I tend to think of social norms as contracts bargained between different groups. In the case of attitudes towards intelligence, those two groups are smart people and dumb people. Since I was both at once, I got to make the bargain with myself, which simplified the bargaining process immensely. The deal I came up with was that I wasn’t going to beat myself up over the areas I was bad at, but I also didn’t get to become too cocky about the areas I was good at. It was all genetic luck of the draw either way. In the meantime, I would try to press as hard as I could to exploit my strengths and cover up my deficiencies. So far I’ve found this to be a really healthy way of treating myself, and it’s the way I try to treat others as well.
Scott Alexander, “The Parable of the Talents”, Slate Star Codex, 2015-01-31.
Comments Off on QotD: IQ and different types of intelligence
August 14, 2016
QotD: Women in graduate math programs
Academic programs presumably want people with high ability. The GRE bills itself as an ability test, and under our expanded definition of ability this is a reasonable claim. So let’s talk about what would happen if programs selected based solely on ability as measured by GREs.
This is, of course, not the whole story. Programs also use a lot of other things like grades, interviews, and publications. But these are all correlated with GRE scores, and anyway it’s nice to have a single number to work with. So for now let’s suppose colleges accept applicants based entirely on GRE scores and see what happens. The STEM subjects we’re looking at here are presumably most interested in GRE Quantitative, so once again we’ll focus on that.
Mathematics unsurprisingly has the highest required GRE Quantitative score. Suppose that the GRE score of the average Mathematics student – 162.0 – represents the average level that Mathematics departments are aiming for – ie you must be this smart to enter.
The average man gets 154.3 ± 8.6 on GRE Quantitative. The average woman gets 149.4 ± 8.1. So the threshold for Mathematics admission is 7.7 points ahead of the average male test-taker, or 0.9 male standard deviation units. This same threshold is 12.6 points ahead of the average female test-taker, or 1.55 female standard deviation units.
GRE scores are designed to follow a normal distribution, so we can plug all of this into our handy-dandy normal distribution calculator and find that 19% of men and 6% of women taking the GRE meet the score threshold to get into graduate level Mathematics. 191,394 men and 244,712 women took the GRE last year, so there will be about 36,400 men and 14,700 women who pass the score bar and qualify for graduate level mathematics. That means the pool of people who can do graduate Mathematics is 29% female. And when we look at the actual gender balance in graduate Mathematics, it’s also 29% female.
Vast rivers of ink have been spilled upon the question of why so few women are in graduate Mathematics programs. Are interviewers misogynist? Are graduate students denied work-life balance? Do stereotypes cause professors to “punish” women who don’t live up to their sexist expectations? Is there a culture of sexual harassment among mathematicians?
But if you assume that Mathematics departments are selecting applicants based on the thing they double-dog swear they are selecting applicants based on, there is literally nothing left to be explained.
I am sort of cheating here. The exact perfect prediction in Mathematics is a coincidence. And I can’t extend this methodology rigorously to any other subject because I would need a much more complicated model where people of a given score level are taken out of the pool as they choose the highest-score-requiring discipline, leaving fewer high-score people available for the low-score-requiring ones. Without this more complicated task, at best I can set a maximum expected gender imbalance, then eyeball whether the observed deviation from that maximum is more or less than expected. Doing such eyeballing, there are slightly fewer women in graduate Physics and Computer Science than expected and slightly more women in graduate Economics than expected.
But on the whole, the prediction is very good. That it is not perfect means there is still some room to talk about differences in stereotypes and work-life balance and so on creating moderate deviations from the predicted ratio in a few areas like computer science. But this is arguing over the scraps of variance left over, after differences in mathematical ability have devoured their share.
Scott Alexander, “Perceptions of Required Ability Act As A Proxy For Actual Required Ability In Explaining The Gender Gap”, Slate Star Codex, 2015-01-24.
Comments Off on QotD: Women in graduate math programs
October 5, 2015
Why are women under-represented in STEM?
Yet another link I meant to post a while back, but it got lost in the shuffle:
Readers of the higher education press and literature may be forgiven for supposing that there is more research on why there are not more women in STEM fields than there is actual research in the STEM fields themselves. The latest addition to this growing pile of studies appeared a few months ago in Science, and now Science has just published a new study refuting the earlier one.
In the earlier study, “Expectations of Brilliance Underlie Gender Distributions Across Academic Disciplines,” Sarah-Jane Leslie, a philosophy professor at Princeton, and several co-authors surveyed more than 1800 academics across 30 disciplines — graduate students, postdocs, junior and senior faculty — to determine the extent of their agreement with such statements as, “Being a top scholar of [your field] requires a special aptitude that just can’t be taught” and whether “men are more often suited than women to do high-level work in [your field.]”
Fields that believe innate brilliance is essential to high success, such as physics and philosophy, have a significantly smaller proportion of women than fields that don’t, such as Psychology and Molecular Biology.
[…]
What Ginther and Kahn found, in short, is that it was not “expectations of brilliance” that predicted the representation of women in various fields “but mathematical ability, especially relative to verbal ability…. While field-specific ability beliefs were negatively correlated with the percentage of female Ph.D.s in a field, this correlation is likely explained by women being less likely than men to study these math-intensive fields.”
Ginther’s and Kahn’s argument was anticipated and developed even beyond theirs by psychiatrist Scott Alexander in a brilliant long entry on his widely read Slate Codex blog, “Perceptions of Required Ability Act As A Proxy For Actual Required Ability In Explaining The Gender Gap.” His criticism of Leslie et al. is even more devastating:
Imagine a study with the following methodology. You survey a bunch of people to get their perceptions of who is a smoker (“97% of his close friends agree Bob smokes.”) Then you correlate those numbers with who gets lung cancer. Your statistics program lights up like a Christmas tree with a bunch of super-strong correlations. You conclude, “Perception of being a smoker causes lung cancer,” and make up a theory about how negative stereotypes of smokers cause stress which depresses the immune system. The media reports that as “Smoking Doesn’t Cause Cancer, Stereotypes Do.”
This is the basic principle behind Leslie et al.
Like Ginther and Kahn, who did not cite his work, Alexander disaggregated the quantitative from the verbal GRE scores and found that the correlation between quantitative GRE score and percent of women in a discipline to be “among the strongest correlations I have ever seen in social science data. It is much larger than Leslie et al’s correlation with perceived innate ability. Alexander’s piece, and in fact his entire blog, should be required reading.
Comments Off on Why are women under-represented in STEM?
September 29, 2014
When I started fencing, I was told there was no math…
John Turner sent me a link to this short article in Slate‘s “The Vault” column, discussing the mathematical side of fencing:
Girard Thibault’s Académie de l’Espée (1628) puts the art of wielding the sword on mathematical foundations. For Thibault, a Dutch fencing master from the early seventeenth century, geometrical rules determined each and every aspect of fencing. For example, the length of your rapier’s blade should never exceed the distance between your feet and the navel, and your movements in a fight should always be along the lines of a circle whose diameter is equal to your height.
The rest of his manual, geared towards gentlemanly readers who took up fencing as a noble sport, is filled with similar geometrical arguments about the choreography of swordsmanship. Thibault’s work belongs to the same tradition that produced Leonardo’s renowned Vitruvian Man.
“Human proportions and their relationship to swordsmanship.” Engraving by J. Gelle. By Girard Thibault. (Click to see full-sized image.)

Comments Off on When I started fencing, I was told there was no math…
July 15, 2014
The attraction (and danger) of computer-based models
Warren Meyer explains why computer models can be incredibly useful tools, but they are not the same thing as an actual proof:
Among the objections, including one from Green Party politician Chit Chong, were that Lawson’s views were not supported by evidence from computer modeling.
I see this all the time. A lot of things astound me in the climate debate, but perhaps the most astounding has been to be accused of being “anti-science” by people who have such a poor grasp of the scientific process.
Computer models and their output are not evidence of anything. Computer models are extremely useful when we have hypotheses about complex, multi-variable systems. It may not be immediately obvious how to test these hypotheses, so computer models can take these hypothesized formulas and generate predicted values of measurable variables that can then be used to compare to actual physical observations.
[…]
The other problem with computer models, besides the fact that they are not and cannot constitute evidence in and of themselves, is that their results are often sensitive to small changes in tuning or setting of variables, and that these decisions about tuning are often totally opaque to outsiders.
I did computer modelling for years, though of markets and economics rather than climate. But the techniques are substantially the same. And the pitfalls.
Confession time. In my very early days as a consultant, I did something I am not proud of. I was responsible for a complex market model based on a lot of market research and customer service data. Less than a day before the big presentation, and with all the charts and conclusions made, I found a mistake that skewed the results. In later years I would have the moral courage and confidence to cry foul and halt the process, but at the time I ended up tweaking a few key variables to make the model continue to spit out results consistent with our conclusion. It is embarrassing enough I have trouble writing this for public consumption 25 years later.
But it was so easy. A few tweaks to assumptions and I could get the answer I wanted. And no one would ever know. Someone could stare at the model for an hour and not recognize the tuning.
Comments Off on The attraction (and danger) of computer-based models


