David Friedman on his attempts to follow up on claims made in a textbook on climate change already in use in US public schools:
Introduction to Modern Climate Change by Andrew Dessler is an elementary climate science textbook, now in its third edition. In Chapter 9, “Impacts of Climate Change”, it has:
Scientists predict that sea level will rise 47 to 73 cm (19 to 29 inches) above 1995–2014 levels by 2100. This may not sound like a significant challenge, but it is much larger than the 18 cm of sea level experienced over the twentieth century, which is already challenging for many who live near sea level. Like temperature, these predictions of sea-level rise might sound small but, also like temperature, they are not. In Florida, for example, a sea-level rise in the middle of the projected range would inundate 9 percent of Florida’s current land area at high tide. This includes virtually all of the Florida Keys as well as 70 percent of Miami-Dade County. Almost one-tenth of Florida’s current population, or nearly 2 million people, live in this vulnerable zone, and it includes residential real estate valued at hundreds of billions of dollars. It also includes important infrastructure, such as two nuclear reactors, three prisons, and 68 hospitals.
That struck me as implausible, given what else I had seen on the effect of sea level rise. The footnote for the claim was to Stanton and Ackerman (2007), which turned out to be not a peer reviewed journal article but a report commissioned by the Environmental Defense fund, an environmentalist group. It includes the same claims, but for 27 inches of sea-level rise not the 24 inches that is Dessler’s “middle of the projected range”. It refers the reader to Appendix C for “detailed sources and methodology”. Going there, I found:
To estimate the impact of sea-level rise on land area, populations, and public and private assets and infrastructure, we began with a 1:250,000 Digital Elevation Model (DEM) map of the State of Florida, and divided the state into “vulnerable” and “not vulnerable” zones demarcated by 1.5 meters of elevation and other factors described by Titus and Richman (2000) as corresponding to 27 inches of sea-level rise.
So what they are showing as the vulnerable area is not the 27 inch or 24 inch contour but the 1.5 meter (5 feet) contour. The explanation, from Titus, J.G. and C. Richman (2001). “Maps of lands vulnerable to sea level rise: modeled elevations along the US Atlantic and Gulf coasts“. Climate Research 18: 205–228, a journal article written by two EPA people and presumably peer reviewed:
Thus, at a typical site, the 1.5-meter contour would be flooded by spring high tides (i.e., high tides during new and full moons) when sea level rises 80 cm
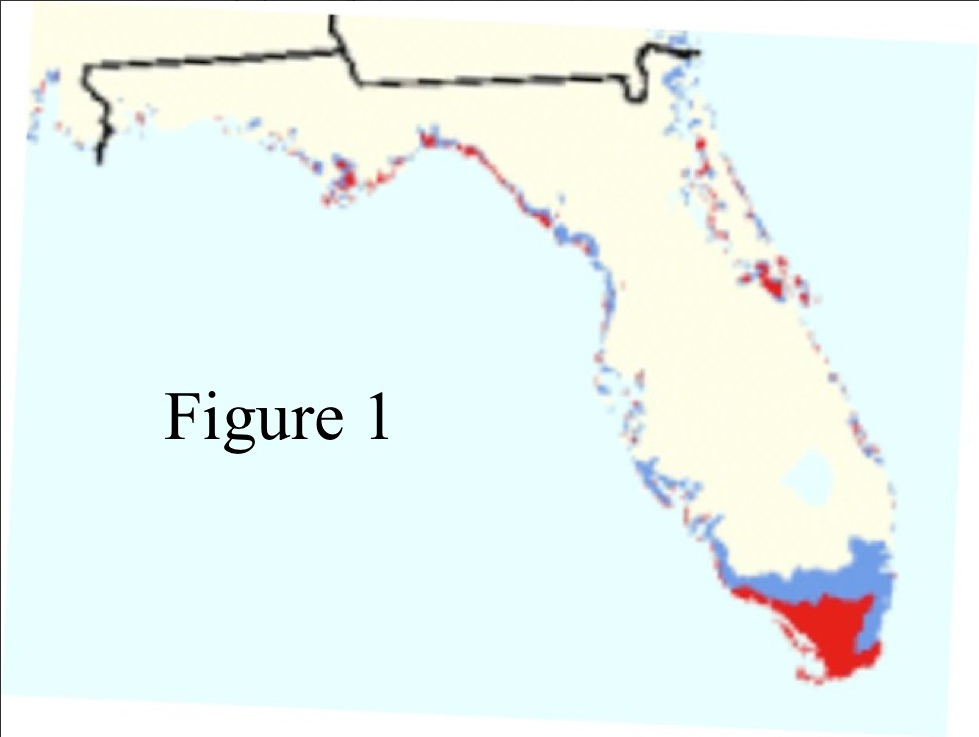
Figure 1 below (Titus and Richman Figure 4) is a map of Florida with the region within the 1.5 meter contour colored red, the region between 1.5 and 3.5 blue. Dessler’s middle of the projected range is 60 cm. Stanton and Ackerman’s 27 inches is 68.6 cm. The map shows what its authors claim would be flooded at 80cm.
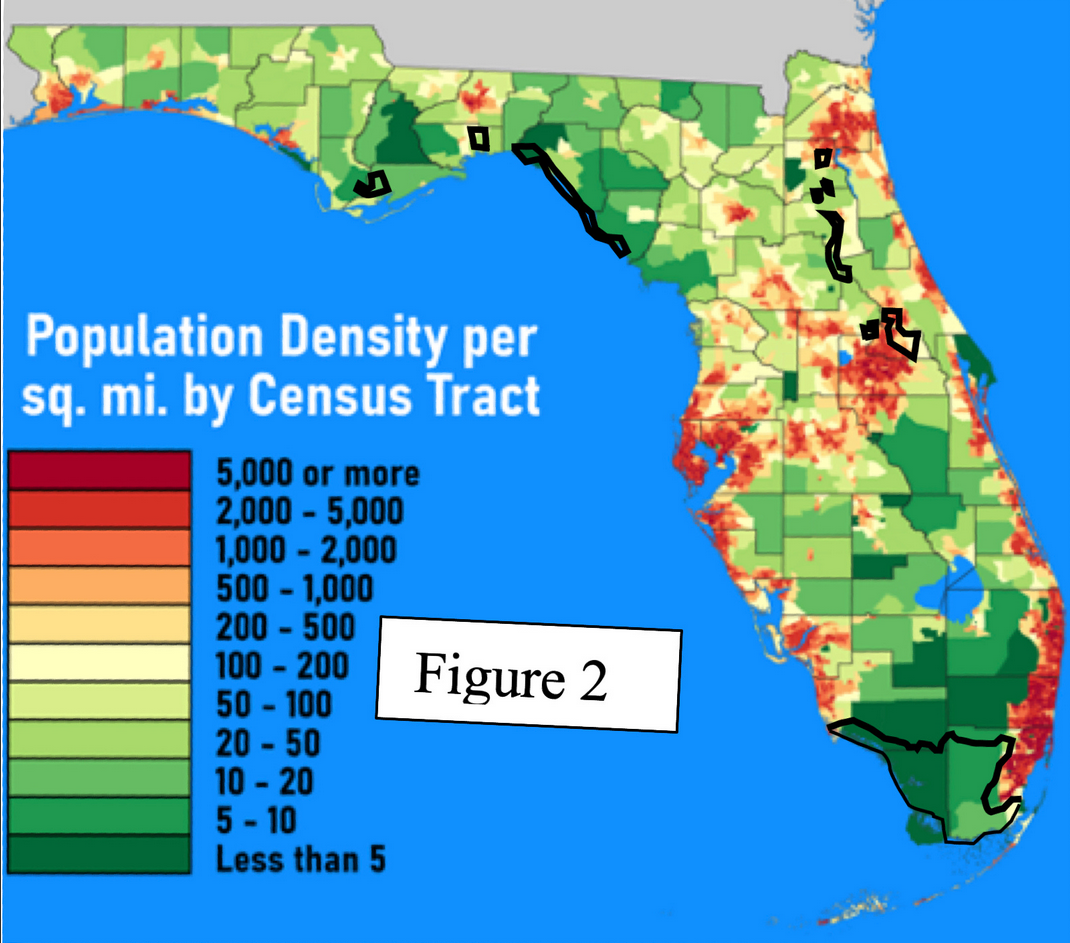
Figure 2 below is a population density map of Florida from Wikipedia to which I have added the 1.5m contours from Figure 1. The large flooded area on the southern tip of Florida includes none of the densely populated area around Miami; only one of the tiny areas farther north appears to be in part on a populated area. That is not surprising — areas very close to sea level are likely to be marsh, in this case the everglades, and poor places to build on.
Stanton and Ackerman claim that their own calculations, using data bases of elevation and population, produce a total population in the at-risk area of 1.5 million. That was the figure Dessler gave in his first edition, presumably increased to almost 2 million in the third edition to reflect the increase in Florida’s population. Figure 2 shows why I don’t believe it. The flooded areas are in places almost all of which have very low population density, making it hard to see how flooding nine percent of the land area, most of it in the everglades, can flood almost ten percent of the population. Even if all of the Florida Keys are flooded, their total population is only about 80,000.
That problem is in addition to the fact that Dessler’s claim is for 60 cm of sea level rise, Stanton and Ackerman’s, from which Dessler got his figure for how many people are flooded, is for 68.6 cm (27 inches), and Titus and Richman get the 1.5 m contour that Stanton and Ackerman say they are using by assuming 80cm of sea level rise. Further reasons for suspicion are that Stanton and Ackerman gave figures for sea level rise substantially higher than either the IPCC figure at the time or the current IPCC figure, which suggests that they were trying to make the consequences of climate change look as scary as possible, and that they write “1.5 meters of elevation and other factors described by Titus and Richman (2000) as corresponding to 27 inches of sea-level rise” when Titus and Richman actually describe 1.5 meters as corresponding to 80 cm (31.5 inches) of sea level rise.