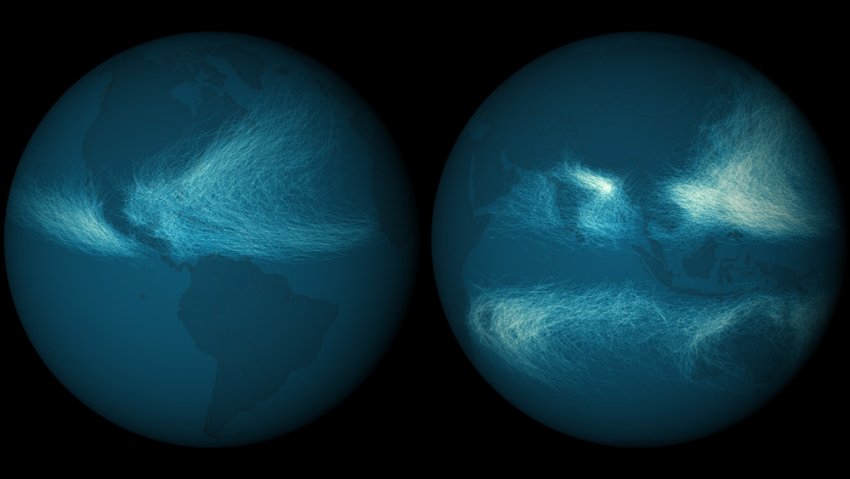
Wired‘s MapLab has a lovely visualization of both hurricane and cyclone tracks starting with the earliest records in 1842:
This map shows the paths of every hurricane and cyclone detected since 1842. Nearly 12,000 tropical cyclones have been tracked and recorded, and the National Oceanic and Atmospheric Administration keeps them all in a single database. Long-term datasets can be really interesting and scientifically valuable, and this one is undoubtedly both.
In the image above, you can clearly see that more storm tracks have overlapped in the western Pacific ocean and northern Indian ocean. This is largely because of the length of the typhoon season, which basically never stops in the warmer waters there.
The tracks of the earliest storms are based on mariner’s logs and storm records, collected from various countries, agencies and other sources. Reconciling data from these different entities was tough. Most international agencies had their own set of codes for cyclone intensity, and only recorded this information once per day. India was even using different wind thresholds to designate cyclone stages.


