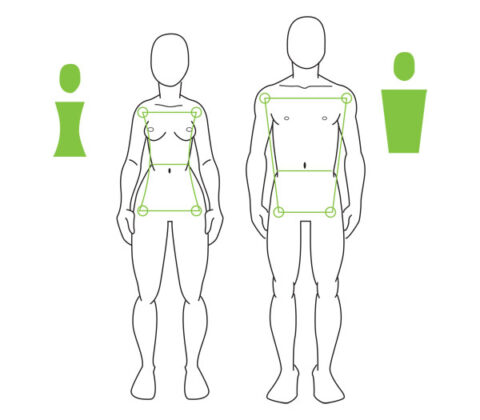
Lorenzo Warby discusses some basic biological differences between men and women and how those differences account for much of the variance in violent behaviour:
(Note on usage: Sex is biological — i.e., which gametes a body is structured to produce. Sex roles are the behavioural manifestation of sex. Gender is the cultural manifestation of sex.)
Adult human males have, on average, about twice the lean upper body mass of adult human females. This means that adult human females have, on average, 52 per cent of the upper body strength of adult human males.
The consequence of this is that men dominate violence between adults. They dominate victims — another male is far more likely to be a physical threat or obstacle than a woman. Men even more strongly dominate perpetrators.
A Swedish study found that one per cent of the population committed almost two-thirds of all violent crimes. That one per cent was almost entirely male. Four per cent of the population committed all the violent crimes. That four percent was almost 90 per cent male1 and constituted just over seven per cent of the male population.
These patterns of behaviour do not require any “hard wired” differences by sex in human brains. They merely require that men have about twice the upper body strength of women. They represent strategic behaviour within that context.
Indeed, these results are not compatible with sex-differentiation being strongly “hard-wired” in brains by sex. The overwhelming majority of men do not commit any violent crimes, while some of the perpetrators —almost eleven per cent — were female.
What makes it even clearer that these patterns represent strategic behaviour—that is, responses grounded in (biological) constraints and capacities — is that men and women each make up about half the perpetrators of violence against children.
When women are dealing with the physically stronger sex, they are much less likely to use violence than is the physically stronger sex. When they are dealing with a systematically weaker group of Homo sapiens — children — they are as likely to be perpetrators of violence as men.
These patterns represent strategic behaviour. They represents actions responding to constraints and capacities. You get sex-differentiated patterns when the constraints are different between men and women. Our sex-differentiated biology is enough, on its own, to produce sex-differentiated patterns of behaviour.
So, even in (then) peaceful Sweden, one in 14 men are violent. That a significant proportion of men are violent predators informs female behaviour, as the systematically physically weaker sex.
Men dominate sexual violence because they are physically stronger, have penises and cannot get pregnant. That is enough to have men dominate sexual violence without any sex differentiation in the “hard-wiring” of brains at all.
We are embodied agents. How we are embodied makes a difference for our behaviour.
Women have, on average, half the lean upper body mass as men not so much because they are smaller—the average differences in height and weight are nowhere near as large. A much more significant factor is that women have a higher fat content to their body, especially their upper body.
They have a higher fat content because human brains are energy hogs, and women are structured to be able to support not just one, but two or more, energy-hog brains — i.e. babies and toddlers. More fat means more readily-available stored energy. That extra female fat enables us Homo sapiens to be the most body-shape dimorphic of the primates: far more so than any of our ape cousins.
This goes to the other biological constraint that produces sex-differentiated behaviour. Women can get pregnant, men cannot. The risk profile differs for men and women, and not just for the risks of pregnancy and childbirth but also for child-rearing.
1. The text of the paper and the summary table have different numbers for female offenders. As the text states that 10.9 per cent of offenders were females, which agrees with the table but not the figures given in the text, I have corrected accordingly. Fortunately, it does not affect the logic being presented.


