… we can say that the Great Library was an extensive collection of books associated with the famous institute of learning and research that was the shrine of the Muses in Alexandria. That much is clear. But many of the other things often claimed about it are much less clear and some of them are pure fantasy, so it’s time to turn to the list of things that the “Great Library” was not.
“It was the largest library in the ancient world, containing over 700,000 books.”
It is entirely possible that it was the largest library in the ancient world, though we have no way of confirming this given that we have little reliable information about the size of its collection. Despite this, popular sources regularly repeat the huge figures given for the number of books in the library in several ancient sources, and usually opt for the ones that are the highest. Shakespeare scholar Stephen Greenblatt’s popular history The Swerve: How the Renaissance Began (Vintage, 2012) won critical acclaim and even garnered him a Pulitzer Prize, despite being panned by actual historians for its many howlers and weirdly old-fashioned historiography (see my detailed critical review here, with links to other scathing critiques by historians). Greenblatt’s account sticks closely to the nineteenth century narrative of “the dark ages” beloved by New Atheists, so it’s hardly surprising that the myths about the Great Library feature prominently in his account. Thus he informs his readers with great assurance that:
“At its height the Museum contained at least half a million papyrus rolls systematically organised, labelled and shelved according to a clever new system … alphabetical order.” (Greenblatt, p. 88)
The figure of “half a million scrolls” (or even “half a million books”) is the one that is usually bandied about, but even that colossal number is not quite enough for some polemicists. Attorney and columnist Jonathan Kirsch plumped for a much higher number in his book God Against the Gods: The History of the War Between Monotheism and Polytheism (Viking, 2004)
“In 390 AD … a mob of Christian zealots attacked the ancient library of Alexandria, a place where the works of the greatest rarity and antiquity had been collected … some 700,000 volumes and scrolls in all.” (Kirsch, p. 278)
Obviously the larger the collection in the Great Library the more terrible the tragedy of its loss, so those seeking to apportion blame for the supposed destruction of the Library usually go for these much higher numbers (it may be no surprise to learn that it’s the monotheists who are the “bad guys” in Kirsch’s cartoonish book). But did the Great Library really contain this huge number of books given that these numbers would represent a large library collection even today?
As with most things on this subject, it seems the answer is no. […] Some of these figures are interdependent, so for example Ammianus is probably depending, directly or indirectly, on Aulus Gellius for his “700,000” figure, which in turn is where Kirsch gets the same number in the quote above. Others look suspiciously precise, such as Epiphanius’ “54,800”. In summary of a lot of discussion by critical scholars, the best thing to say is that none of these figures is reliable. In her survey of the historiography of the issue, Diana Delia notes “lacking modern inventory systems, ancient librarians, even if they cared to, scarcely had the time or means to count their collections” (see Delia, “From Romance to Rhetoric: The Alexandrian Library in Classical and Islamic Traditions”, The American Historical Review, Vol. 97, No. 5, Dec. 1992, pp. 1449-67, p. 1459). Or as another historian once put it wryly “There are no statistics in ancient sources, just rhetorical flourishes made with numbers.”
One way that historians can make estimates of the size of ancient libraries is by examining the floor plans of their ruins and calculating the space their book niches would have taken up around the walls and then the number of scrolls each niche could hold. This works for some other ancient libraries for which we have surveyable remains, but unfortunately that is not the case for the Mouseion, given that archaeologists still have to guess where exactly it stood. So Columbia University’s Roger S. Bagnall has taken another tack. In a 2002 paper that debunks several of the myths about the Great Library (see Bagnall, “Alexandria: Library of Dreams”, Proceedings of the American Philosophical Society, Vol. 146, No. 4, Dec. 2002, pp. 348-362), he begins with how many authors we know were writing in the early Hellenistic period. He notes that we know of around 450 authors for whom we have, at the very least, some lines of writing whose work existed in the fourth century BC and another 175 from the third century BC. He points out that most of these writers probably only wrote works that filled a couple of scrolls at most, though a small number of them – like the playwrights – would have had a total corpus that filled many more than that, even up to 100 scrolls. So by adopting the almost certainly far too high figure of an average of 50 scrolls to contain the work of each writer, Bagnall arrives as a mere 31,250 scrolls to contain all the works of all the writers we know about to the end of the third century. He notes:
“We must then assume, to save the ancient figures for the contents of the Library, either that more than 90 percent of classical authors are not even quoted or cited in what survives, or that the Ptolemies acquired a dozen copies of everything, or some combination of these unlikely hypotheses. If we were (more plausibly) to use a lower average output per author, the hypotheses needed to save the numbers would become proportionally more outlandish.” (Bagnall, p. 353)
Bagnall makes other calculations taking into account guesses at what number of completely lost authors there may have been and still does not manage to get close to most of the figures given in our sources. His analysis makes it fairly clear that these numbers, presented so uncritically by popular authors for rhetorical effect, are probable fantasies. As mentioned above, when we can survey the archaeology of an ancient library’s ruins, some estimate can be made of its holdings. The library in the Forum of Trajan in Rome occupied a large space 27 by 20 metres and Lionel Casson estimates it could have held “in the neighbourhood of 20,000 scrolls” (Casson, p. 88). A similar survey of the remains of the Great Library of Pergamon comes to an estimate of 30,000 scrolls there. Given that this library was considered a genuine rival to the Great Library of Alexandria, it is most likely that the latter held around 40-50,000 scrolls at its height, containing a smaller number of works overall given that ancient works usually took up more than one scroll. This still seems to have made it the largest library collection in the ancient world and thus the source of its renown and later myths, but it’s a far cry from the “500,000” or “700,000” claimed by uncritical popular sources and people with axes to grind.
Tim O’Neill, “The Great Myths 5: The Destruction Of The Great Library Of Alexandria”, History for Atheists, 2017-07-02.
May 29, 2023
QotD: The size of the Great Library
May 23, 2023
The Diamond Princess – the “worst case virus mill” during the Covid-19 pandemic
Dr. Todd Kenyon looks at the data from the situation onboard the Diamond Princess early in the pandemic:

Diamond Princess is a cruise ship owned and operated by Princess Cruises. She began operation in March 2004 and primarily cruises in Alaska during the summer and Asia in the winter along with Australia cruises. Diamond Princess and Sapphire Princess were both were built in Nagasaki, Japan by Mitsubishi Heavy Industries.
Photo by Bernard Spragg, NZ via Wikimedia Commons.
The Diamond Princess cruise ship departed Japan on January 20, 2020. Five days later a passenger disembarked, later became ill and tested positive for SARS-CoV-2 infection. On board this ship were 3,711 persons, of which 2,666 were passengers (median age of 69) and 1,045 were crew (median age of 36). Nearly half (48%) of the passengers were said to have underlying disease(s). Passengers and crew began testing positive with some becoming ill, but the passengers were not quarantined in their cabins until Feb 5. Until that time they had been engaging in a variety of typical social activities including shows, buffets and dances. Once quarantined (confined to cabins), most passengers shared cabins with 1 to 3 other passengers. Cabins used unfiltered ventilation and the crew continued their duties and mixed with passengers. Evacuation began in mid February and was completed by March 1.
A total of 712 individuals (19%) tested positive via PCR, and as many as 14 passengers were said to have died, though there are differing opinions as to how many of these deaths should be attributed to Covid. Except for one person in their late 60s, all deaths occurred in those over 70. Not one crew member died. Half of the deaths occurred several weeks after leaving the ship, so it is unclear if they actually died from infections caught onboard. Three ill passengers were given an experimental treatment of Remdesivir once hospitalised on shore; apparently all survived.
The Diamond Princess was termed a “virus mill” by one expert while another remarked that cruise ships are perfect environments for the propagation and spread of viruses. The quarantine procedures inflicted much duress on an already frail passenger base and may have done more harm than good. There was panic and confusion both among passengers and crew, and densely packed passengers sharing unfiltered ventilation were only allowed out of cabins every few days for an hour. Meanwhile the crew continued to prepare meals and mix with passengers, but otherwise were kept confined below the waterline in their cramped multi-resident quarters. Some passengers ignored the quarantine entirely. The so-called “Red Dawn” email discussions among government researchers in early 2020 described the DP as a “quarantine nightmare”. The DP was also termed by this group as representative of a large elderly care home (passengers). Based on all these observations, the DP event should provide a nearly worst case scenario for the first wave of Covid. The question is, how did New York City (NYC) fare versus this “worst case”, and what can we learn from the comparison?
We can start by looking at the infection rate on the DP: 25% of those over 60 and 9% of those under 60 were reportedly infected. On the DP, the case fatality rate (CFR) for those over 60 was 2.6%. This assumes that all 14 deaths of passengers were caused by a Covid-19 infection contracted while on the DP. On the other hand, the CFR for those under 60 years of age was 0.0%, since none in this age bracket died.
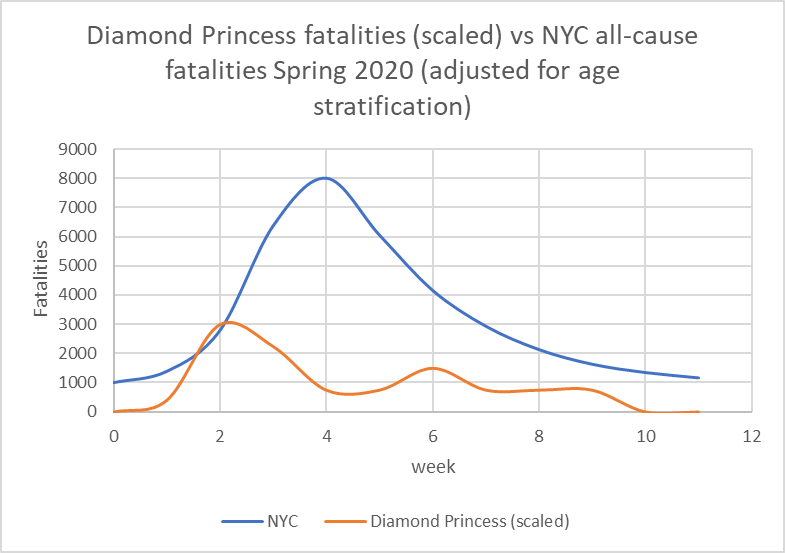
Diamond Princess mortality (scaled) compared to New York City all cause mortality. DP week 1 = first week quarantine imposed while NYC week 1 = first week of lockdown orders (week 12, 2020). DP fatalities are scaled based on relative populations of individuals over 65. It is unclear whether the DP fatalities at the tail end of the curve are attributable to C19 infection contracted months prior on the DP. NYC data: www.mortality.watch
May 14, 2023
Garbage data informs the Canadian government’s approach to gun control issues
In The Line, Tim Thurley points out the (totally expected) bias of the data being considered by the federal government:

A selection of weapons (mostly restricted or prohibited in the hands of most Canadians) displayed by Toronto police after confiscation.
Screencap from a CTV News report in 2018.
The Mass Casualty Commission’s firearm recommendations were, rightly, overlooked in the initial phase after the report’s release. They have become relevant these past weeks as gun control groups, the NDP, the Bloc, and the Liberals used them to advocate for sweeping changes to Bill C-21, the government’s controversial gun-control proposals. The Liberals have thus far declined to adopt the MCC’s recommendations, at least in whole, and that’s encouraging. Our lawmakers should be careful. The Mass Casualty Commission’s concluding recommendations on guns and homicide share a problem common to any data analysis. If you use the wrong data, you get a bad output.
Or, to be blunt: garbage in, garbage out.
R. Blake Brown, a professor who contributed a commissioned report to the MCC, suggested that the MCC got all the best research together and simply found the arguments made by gun control groups to be more convincing.
He’s wrong. While the MCC could have been a completely neutral panel objectively weighing the evidence before it, the nakedly selective choice of data inputs and slanted interpretation meant that no unbiased outcome was possible. Indeed, the MCC inputs seem heavily weighed to advance a pro-control agenda, and do so in such an obvious way that the resulting flaws should be immediately clear to those with even a passing knowledge of the study of firearms and firearm homicide.
[…]
Dr. Caillin Langmann is a well-known name in Canadian firearms research, and by far the most prolific author using rigorous statistical methods to examine the effects of gun control on Canadian firearm mortality. No serious analysis of Canadian firearm mortality is possible without his work, and yet his work does not appear on its own and is not cited in the Negin Report. Indeed, his and other critical research does not seem to have informed the final Commission report or recommendations at all.
I asked Dr. Langmann about his exclusion. He told me he offered to appear to present his research but the Commission declined.
It may not be a coincidence that the exclusion of Langmann and other researchers without explicit gun-control agendas was due to the fact — the fact — that the Canadian and comparable research substantively contradicts the Negin Report and the MCC recommendations on firearms. An examination of already-implemented Canadian gun laws including various factors such as prohibition of “paramilitary style” rifles and magazine capacity restrictions all found no impact on mass shootings or mass homicide overall in Canada or on associated fatalities. Instead, mass homicide by both firearm and non-firearm causes gradually declined on its own. The lack of association between gun control and decreased mortality is replicated multiple times in Canadian research.
Guess what? It is also replicated in a detailed statistical analysis of Australian data not mentioned by the Negin Report.
The core research inputs to the Mass Casualty Commission were commissioned from parties with well-established and acknowledged positions on firearms. Written by literal gun control advocates without substantial input from other sources, the contrary research is either ignored or not treated with due academic respect. This damages the credibility of the Commission findings, giving the perception that they were gathering conclusions in search of evidence.
Again, it must be made clear that this wouldn’t have been a problem if the MCC had treated the Negin Report as just one part of the firearm policy research puzzle. It was their failure to do so and the consequent lack of neutrality, lack of engagement with solid research, and complete disregard for engagement with different academic perspectives despite obvious relevant expertise, that taints the Mass Casualty Commission firearm recommendations and severely limits any useful policy conclusions we can gather from their report.
April 28, 2023
Use and misuse of the term “regression to the mean”
I still follow my favourite pro football team, the Minnesota Vikings, and last year they hired a new General Manager who was unlike the previous GM in that not only was he a big believer in analytics, he actually had worked in the analytics area for years before moving into an executive position. The first NFL draft under the new GM and head coach was much more in line with what the public analytics fans wanted — although the result on the field is still undetermined as only one player in that draft class got significant playing time. Freddie deBoer is a fan of analytics, but he wants to help people understand what the frequently misunderstood term “regression to the mean” actually … means:

Kwesi Adofo-Mensah, General Manager of the Minnesota Vikings. Adofo-Mensah was hired in 2022 to replace Rick Spielman.
Photo from the team website – https://www.vikings.com/team/front-office-roster/kwesi-adofo-mensah
The sports analytics movement has proven time and again to help teams win games, across sports and leagues, and so unsurprisingly essentially every team in every major sport employs an analytics department. I in fact find it very annoying that there are still statheads that act like they’re David and not Goliath for this reason. I also think that the impact of analytics on baseball has been a disaster from an entertainment standpoint. There’s a whole lot one could say about the general topic. (I frequently think about the fact that Moneyball helped advance the course of analytics, and analytics is fundamentally correct in its claims, and yet the fundamental narrative of the book was wrong.*) But while the predictive claims of analytics continue to evolve, they’ve been wildly successful.
I want to address one particular bugaboo I have with the way analytical concepts are discussed. It was inevitable that popularizing these concepts was going to lead to some distortion. One topic that I see misused all the time is regression/reversion to the mean, or the tendency of outlier performances to be followed up by performances that are closer to the average (mean) performance for that player or league. (I may use reversion and regression interchangeably here, mostly because I’m too forgetful to keep one in my head at a time.) A guy plays pro baseball for five years, he hits around 10 or 12 homeruns a year, then he has a year where he hits 30, then he goes back to hitting in the low 10s again in following seasons – that’s an example of regression to the mean. After deviation from trends we tend (tend) to see returns to trend. Similarly, if the NFL has a league average of about 4.3 yards per carry for a decade, and then the next year the league average is 4.8 without a rule change or other obvious candidate for differences in underlying conditions, that’s a good candidate for regression to the mean the next year, trending back towards that lower average. It certainly doesn’t have to happen, but it’s likely to happen for reasons we’ll talk about.
Intuitively, the actual tendency isn’t hard to understand. But I find that people talk about it in a way that suggests a misunderstanding of why regression to the mean happens, and I want to work through that here.
So. We have a system, like “major league baseball” or “K-12 public education in Baltimore” or “the world”. Within those systems we have quantitative phenomena (like on-base percentage, test scores, or the price of oil) that are explainable by multiple variables, AKA the conditions in which the observed phenomena occur. Over time, we observe trends in those phenomena, which can be in the system as a whole (leaguewide batting average), in subgroups (team batting average), or individuals (a player’s batting average). Those trends are the result of underlying variables/conditions, which include internal factors like an athlete’s level of ability, as well as elements of chance and unaccounted-for variability. (We could go into a big thing about what “chance” really refers to in a complex system, but … let’s not.) The more time goes on, and the more data is collected, the more confidently we can say that a trend is an accurate representation of some underlying reality, again like an athlete’s level of ability. When we say a baseball player is a good hitter, it’s because we’ve observed over time that he has produced good statistics in hitting, and we feel confident that this consistency is the product of his skill and attributes rather than exogenous factors.
However, we know that good hitters have bad games, just as bad hitters have good games. We know that good hitters have slumps where they have bad three or five or ten etc game stretches. We even acknowledge that someone can be a good hitter and have a bad season, or at least a season that’s below their usual standards. However, if a hitter has two or three bad seasons, we’re likely to stop seeing poor performance as an outlier and change our overall perception of the player. The outlier becomes the trend. There is no certain or objective place where that transition happens.
Here’s the really essential point I want to make: outliers tend to revert to the mean because the initial outlier performance was statistically unlikely; a repeat of that outlier performance is statistically unlikely for the same reasons, but not because of the previous outlier. For ease of understanding let’s pretend underlying conditions stay exactly the same, which of course will never happen in a real-world scenario. If that’s true, then the chance of having an equally unlikely outcome is exactly as likely as the first time; repetition of outliers is not made any less likely by the fact that the initial outlier happened. That is, there’s no inherent reason why a repetition of the outlier becomes more unlikely, given consistent underlying conditions. I think it’s really important to avoid the Gambler’s Fallacy here, thinking that a roulette wheel is somehow more likely to come up red because it’s come up black a hundred times in a row. Statistically unlikely outcomes in the past don’t make statistically unlikely outcomes any less likely in the future. The universe doesn’t “remember” that there’s been an outlier before. Reversion to the mean is not a force in the universe. It’s not a matter of results being bent back into the previous trend by the gods. Rather, if underlying conditions are similar (if a player is about as good as he was the previous year and the role of variability and chance remains the same), and he had an unlikely level of success/failure the prior year, he’s unlikely to repeat that performance because reaching that level of performance was unlikely in the first place.
* – the A’s not only were not a uniquely bad franchise, they had won the most games of any team in major league baseball in the ten years prior to the Moneyball season
– major league baseball had entered an era of unusual parity at that time, belying Michael Lewis’s implication that it was a game of haves and have-nots
– readers come away from the book convinced that the A’s won so many games because of Scott Hatteberg and Chad Bradford, the players that epitomize the Moneyball ethos, but the numbers tell us they were so successful because of a remarkably effective rotation in Tim Hudson, Barry Zito, and Mark Mulder, and the offensive skill of shortstop Miguel Tejada – all of whom were very highly regarded players according to the old-school scouting approach that the book has such disdain for.
– Art Howe was not an obstructionist asshole.
April 5, 2023
Justin Trudeau chooses the Argentinian model over the Canadian model
In The Line, Matt Gurney considers the proposition that “Canada is broken”:
To the growing list of articles grappling with the issue of whether Canada is broken — and how it’s broken, if it is — we can add this one, by the Globe and Mail‘s Tony Keller. I can say with all sincerity that Keller’s is one of the better, more thoughtful examples in this expanding ouevre. Keller takes the issue seriously, which is more than can be said of some Canadian thought leaders, whose response to the question is often akin to the Bruce Ismay character from Titanic after being told the ship is doomed.
(Spoiler: it sank.)
But back to the Globe article. Specifically, Keller writes about how once upon a time, just over a century ago, Canada and Argentina seemed to be on about the same trajectory toward prosperity and stability. If anything, Argentina may have had the edge. Those with much grasp of 20th-century history will recall that that isn’t exactly how things panned out. I hope readers will indulge me a long quote from Keller’s piece, which summarizes the key points:
By the last third of the 20th century, [Argentina] had performed a rare feat: it had gone backward, from one of the most developed countries to what the International Monetary Fund now classifies as a developing country. Argentina’s economic output is today far below Canada’s, and consequently the average Argentinian’s income is far below that of the average Canadian.
Argentina was not flattened by a meteor or depopulated by a plague. It was not ground into rubble by warring armies. What happened to Argentina were bad choices, bad policies and bad government.
It made no difference that these were often politically popular. If anything, it made things worse since the bad decisions – from protectionism to resources wasted on misguided industrial policies to meddling in markets to control prices – were all the more difficult to unwind. Over time the mistakes added up, or rather subtracted down. It was like compound interest in reverse.
And this, Keller warns, might be Canada’s future. As for the claim made by Pierre Poilievre that “Canada is broken”, Keller says this: “It’s not quite right, but it isn’t entirely wrong.”
I disagree with Keller on that, but I suspect that’s because we define “broken” differently. We at The Line have tried to make this point before, and it’s worth repeating here: we think a lot of the pushback against the suggestion that Canada might be broken is because Canada is still prosperous, comfy, generally safe, and all the rest. Many, old enough to live in paid-off homes that are suddenly worth a fortune, may be enjoying the best years of their lives, at least financially speaking. Suggesting that this is “broken” sometimes seems absurd.
But it’s not: it’s possible we are broken but enjoying a lag period, spared from feeling the full effects of the breakdown by our accumulated wealth and social capital. The engines have stopped, so to speak, but we still have enough momentum to keep sailing for a bit. Put more bluntly, “broken” isn’t a synonym for “destroyed”. A country can still be prosperous and stable and also be broken — especially if it was prosperous and stable for long enough before it broke. The question then becomes how long the prosperity and stability will last. Canada is probably rich enough to get away with being broken for a good long while. What’s already in the pantry will keep us fed and happy for years to come.
But not indefinitely.

March 26, 2023
Plandemic? Manufactured crisis? Mass formation psychosis?
In The Conservative Woman, James Delingpole lets his skeptic flag fly:

“Covid 19 Masks” by baldeaglebluff is licensed under CC BY-SA 2.0![]()
![]()
![]()
Tell me about your personal experiences of Covid 19. Actually, wait, don’t. I think I may have heard it already, about a million times. You lost all sense of smell or taste – and just how weird was that? It floored you for days. It gave you a funny dry cough, the dryness and ticklishness of which was unprecedented in your entire coughing career. You’ve had flu a couple of times and, boy, when you’ve got real flu do you know it. But this definitely wasn’t flu. It was so completely different from anything you’ve ever known, why you wouldn’t be surprised to learn that it had been bioengineered in a lab with all manner of spike proteins and gain-of-function additives, perhaps even up to and including fragments of the Aids virus …
Yeah, right. Forgive me for treading on the sacred, personal domain of your lived experience. But might I cautiously suggest that none of what you went through necessarily validates lab-leak theory. Rather what it may demonstrate is the power of susceptibility, brainwashing and an overactive imagination. You lived – we all did – through a two-year period in which health-suffering anecdotes became valuable currency. Whereas in the years before the “pandemic”, no one had been much interested in the gory details of your nasty cold, suddenly everyone wanted to compare notes to see whether they’d had it as bad as you – or, preferably, for the sake of oneupmanship, even worse. This in turn created a self-reinforcing mechanism of Covid panic escalation: the more everyone talked about it, the more inconvertible the “pandemic” became.
Meanwhile, in the real world, hard evidence – as opposed to anecdotal evidence – for this “pandemic” remained stubbornly non-existent. The clincher for me was a landmark article published in January 2021 by Simon Elmer at his website Architects For Social Housing. It was titled “Lies, Damned Lies and Statistics: Manufacturing the Crisis”.
In it Elmer asked the question every journalist should have asked but which almost none did: is this “pandemic” really as serious as all the experts, and government ministers and media outlets and medics are telling us it is? The answer was a very obvious No. As the Office for National Statistics data cited by Elmer clearly showed, 2020 – Year Zero for supposedly the biggest public health threat since “Spanish Flu” a century earlier – was one of the milder years for death in the lives of most people.
Let’s be clear about this point, because something you often hear people on the sceptical side of the argument say is, “Of course, no one is suggesting that Covid didn’t cause a horrific number of deaths.” But that’s exactly what they should be suggesting: because it’s true. Elmer was quoting the Age Standardised Mortality statistics for England and Wales dating back to 1941. What these show is that in every year up to and including 2008, more people died per head of population than in the deadly Covid outbreak year of 2020. Of the previous 79 years, 2020 had the 12th lowest mortality rate.
Covid, in other words, was a pandemic of the imagination, of anecdote, of emotion rather than of measured ill-health and death. Yet even now, when I draw someone’s attention to that ONS data, I find that the most common response I get is one of denial. That is, when presented with the clearest, most untainted (this was before ONS got politicised and began cooking the books), impossible-to-refute evidence that there was NO Covid pandemic in 2020, most people, even intelligent ones, still choose to go with their feelings rather with the hard data.
This natural tendency many of us have to choose emotive narratives over cool evidence makes us ripe for exploitation by the cynical and unscrupulous. We saw this during the pandemic when the majority fell for the exciting but mendacious story that they were living through a new Great Plague, and that only by observing bizarre rituals – putting strips of cloth over one’s face, dancing round one another in supermarkets, injecting unknown substances into one’s body – could one hope to save oneself and granny. And we’re seeing it now, in a slightly different variant, in which lots of people – even many who ought to know better – are falling for some similarly thrilling but erroneous nonsense about lab-leaked viruses.
It’s such a sexy story that I fell for it myself. In those early days when all the papers were still dutifully trotting out World Health Organisation-approved propaganda about pangolins and bats and the apparently notorious wet market (whatever the hell that is) in Wuhan, I was already well ahead of the game. I knew, I just knew, as all the edgy, fearless seekers of truth did that it was a lab leak wot done it. If you knew where to dig, there was a clear evidence trail to support it.
We edgy, fearless truth seekers knew all the names and facts. Dodgy Peter Daszak of the EcoHealth Alliance was in it up to the neck; so too, obviously, was the loathsomely chipper and smugly deceitful Anthony Fauci. We knew that all this crazy, Frankenvirus research had initially been conducted in Chapel Hill, North Carolina, but had been outsourced to China after President Obama changed the regulations and it became too much of a hot potato for US-based labs. And let’s not forget Ukraine – all those secret bio-research labs run on behalf of the US Deep State, but then exposed as the Russians unhelpfully overran territory such as Mariupol.
March 21, 2023
Few professions are as “optimism biased” as primary school teachers
Freddie deBoer was commissioned to write this for a professional publication for teachers, but it was “too hot” for the editors, so he’s posted it to his Substack instead:

There’s a bias that runs throughout our educational discourse, coming from our media, academia, and the think tanks and foundations that have such sway in education policy. It’s a bias that exists both because of a natural human desire to see every child succeed and because the structural incentives in the field make rejecting that bias professionally risky. The bias I’m talking about is optimism bias, the insistence that all problems in education are solvable and that we can fix them if only we want to badly enough. At least a half-century of research, spending, policy experimentation, and dogged effort has utterly failed to close the gaps that so vex our political class. But still we hear the same old song about how we could close those gaps tomorrow if we really wanted to, an attitude that has distorted education policy and analysis for decades.
My first book, The Cult of Smart, was a commercial failure. It was released during the height of the pandemic and thus my ability to promote it was limited, but by any measure the market rejected it. It’s tough to produce a labor of love like that and find that few people were interested in it.
But there was a silver lining: since publication in 2020 I’ve heard from dozens and dozens of teachers, thanking me for putting their thoughts to print. These educators come from public, private, and charter schools, from schools with affluent study bodies and schools that are mired in poverty, from big city school districts and from low-population regional rural schools. And again and again, these teachers shared the same perspective: they agreed with the book’s overall argument, and often had thought similar things themselves for years, but felt they could not express them publicly for fear of professional consequences.
The essential argument of the book is that overwhelming empirical evidence shows that students sort themselves into academic ability bands in the performance spectrum early in life, with remarkable consistency; that the most natural and simplest explanation for this tendency is that there is such a thing as individual academic potential; and that the most likely source of this individual academic potential is likely influenced by genes. When we look at academic performance, what we see again and again is that students perform at a given level relative to peers early in schooling and maintain that level throughout formal education. (I make that case at considerable length here.) A vast number of interventions thought to influence relative performance have been revealed to make no difference in rigorous research, including truly dramatic changes to schooling and environment. Meta-analyses and literature reviews that assess the strength of many different educational interventions find effect sizes in the range of .01 to .3 standard deviations, small by any standards and subject to all sorts of questions about research quality and randomization. Even the most optimistic reading of the research literature suggests that almost nothing moves the needle in academic outcomes. Almost nothing we try works.
This implies that common sense is correct and that individual students have their own natural or intrinsic level of academic potential, which we have no reason to believe we can dramatically change. I believe that we can change large group disparities in education (such as the racial achievement gap) by addressing major socioeconomic inequalities through government policy. But even after we eliminate racial or gender gaps, there will be wide differences between individual students, regardless of pedagogy or policy. When Black students as a group score at parity with white students, there will still be large gaps within the population of Black students or white or any other group you can name, and we have no reliable interventions to make the weakest perform like the strongest.
My book’s argument is attractive to teachers because they’ve lived under an educational ideology that insists that every student is a budding genius whose potential waits to be unlocked by a dedicated teacher – and which holds teachers to that unachievable standard. From the right, they’re subject to “no excuses” culture, the constant insistence from the education reform movement that student failures are the result of lazy and feckless teachers; from the left, they’re subject to a misguided egalitarianism that mistakes the fact that every child is important and deserves to be nurtured for the idea that every child has perfectly equal potential. The result is a system that presses teachers to deliver learning outcomes in their classrooms that they can’t possibly achieve. But many of them feel that they can’t push back, for fear of professional consequences. If they speak frankly about the fact that different students have different levels of individual potential, they’ll likely be accused of shirking their duty.
January 20, 2023
Christopher Snowden on our latest “Clown World” alcohol guidelines
At Velvet Glove, Iron Fist, Christopher Snowden pokes gigantic holes in the stated justification for the latest Canadian drink consumption recommendations (also mentioned in this post yesterday):

“Pelee Island winery”by John Kannenberg is licensed under CC BY-NC-ND 2.0![]()
![]()
![]()
![]()
Canada is on the brink of making itself an international laughing stock by cutting its drinking guidelines from two drinks a day to two drinks a week. The previous guidelines were only set in 2011 so Canadian drinkers can be forgiven for being suspicious about this dramatic change. The evidence base has not significantly changed in the interim. The evidence for the health benefits of moderate drinking has continued to pile up.
The only thing that has really changed is that neo-temperance zealots like Tim Stockwell have tightened their grip on alcohol research. Stockwell and his “no safe level” pal Tim Naimi both live in Canada and are both authors of the report that has made the ludicrous new recommendations.
I have been saying for over a decade that the “public health” plan is to get the guidelines down to zero so they can start regulating alcohol like tobacco. The evidence does not support this fundamentally ideological campaign and so the evidence has been dropped in favour of fantasy modelling and cherry-picking.
[…]
A Canadian “standard drink” contains 13.45 grams of alcohol. Three standard drinks equals 40 grams. Four standard drinks equals 53 grams. The meta-analysis has no data on people who drink so little, so the claim that colon cancer risk increases at three or more standard drinks is not supported even by the authors’ own preferred source.
As for breast cancer, which can only affect half the population and is partly why most countries have different guidelines for men and women, the report cites this meta-analysis of 22 studies, 13 of which found no statistically significant association with drinking. It pooled the studies and reported a 10 per cent increase in risk for people drinking 10 grams of alcohol a day. As with the colon cancer study, this was the minimum quantity studied so it tells us nothing about Canadians who drink 3-5 standard drinks.
In terms of mortality, another meta-analysis found that light drinking was not positively associated with any form of cancer, including breast cancer, and was negatively associated with cancer in a couple of instances […]
As countless studies have shown, heart disease and stroke risk is substantially reduced among light and moderate drinkers. For example, a meta-analysis of prospective cohort studies (which track people’s drinking habits and health status over a number of years and are the most reliable studies in observational epidemiology) found that drinkers were 25 per cent less likely to die from coronary heart disease than teetotallers. The evidence for strokes is similar.
This is main reason why life expectancy is longer for moderate drinkers and the relationship between alcohol consumption and mortality is J-shaped.
The authors of the Canadian report essentially ignore all this evidence and instead focus on a cherry-picked meta-analysis written by Stockwell, Naimi and pals which massively adjusted the figures to arrive at their desired conclusion. This is inexcusable.
At The Line, Jen Gerson points out the utter absurdity of public health officials doing their best Carry Nation bar-smashing imitations while at the same time pushing for “harm reduction” policies for cocaine, heroin, and other illegal narcotics:

“Bayer Makes Heroin” by dog97209 is licensed under CC BY-NC-ND 2.0 ![]()
![]()
![]()
![]() .
.
“The guidance is based on the principle of autonomy in harm reduction and the fundamental idea behind it that people living in Canada have a right to know that all alcohol use comes with risk,” noted the CCSU and, hey, yeah!
I like to understand my risks so that I can make informed decisions.
But you know what else poses significant risk?
Lots of morphine and cocaine.
I think this is generally known. But God help you if you want to engage in a conversation about the risks society might be courting with safe supply or even harm-reduction strategies, and have fun being labelled a Conservative troglodyte who just wants suffering addicts to die in the street. You’re probably just a rich, callous asshole who opposes all of these evidence-based policies who blows second-hand smoke into the faces of your children while drinking your sixth beer of the night at the local pub. Just shut up and pick up those discarded needles in your yard, you monster.
I was picking on Health Canada previously, but they’re hardly the only ones who display a bizarre split-personality on these issues. Any story by or on the CBC on the matter of alcohol use now sounds like something straight out of the Women’s Christian Temperance Union. Yet just try to find critical reporting on safe consumption sites or safe supply policies. Almost all of it is uniformly glowing.
[…]
Obviously, I don’t think that our public-health officials are telling Canadians that heroin takes the edge off a hard day better than a glass of red or a pint of beer. But did we learn nothing over the course of the pandemic about the importance of consistent and clear public-health communications? The target audience for this is not those who have carefully studied harm reduction and substance use disorders. It’s people who just like to have a drink with dinner.
If our governments want to maintain any credibility, they can’t be uptight about how many glasses of pinot noir we drink, and then appear to be loosey goosey on heroin. It’s just impossible to take that kind of suck-and-blow at face value, but that’s exactly how this messaging will come across to people who aren’t closely engaged with this issue. “The government wants to give free hard drugs to junkies but thinks my cocktail is a problem?”
January 3, 2023
1943 in Numbers – WW2 Special
World War Two
Published 1 Jan 2023This war is massive. Our chronological coverage helps give us an understanding of it, but sometimes statistics help us understand the bigger picture.
(more…)
December 29, 2022
Selection bias in polling
At Astral Codex Ten, Scott Alexander points out that it’s impossible to do any kind of poll without some selection bias, so you can’t automatically dismiss any given poll on that basis. The kind of selection bias, however, may indicate whether the results will have any relationship to reality:
The real studies by professional scientists usually use Psych 101 students at the professional scientists’ university. Or sometimes they will put up a flyer on a bulletin board in town, saying “Earn $10 By Participating In A Study!” in which case their population will be selected for people who want $10 (poor people, bored people, etc). Sometimes the scientists will get really into cross-cultural research, and retest their hypothesis on various primitive tribes — in which case their population will be selected for the primitive tribes that don’t murder scientists who try to study them. As far as I know, nobody in history has ever done a psychology study on a truly representative sample of the world population.
This is fine. Why?
Selection bias is disastrous if you’re trying to do something like a poll or census. That is, if you want to know “What percent of Americans own smartphones?” then any selection at all limits your result. The percent of Psych 101 undergrads who own smartphones is different from the percent of poor people who want $10 who own smartphones, and both are different from the percent of Americans who own smartphones. The same is potentially true about “how many people oppose abortion?” or “what percent of people are color blind?” or anything else trying to find out how common something is in the population. The only good ways to do this are a) use a giant government dataset that literally includes everyone, b) hire a polling company like Gallup which has tried really hard to get a panel that includes the exact right number of Hispanic people and elderly people and homeless people and every other demographic, c) do a lot of statistical adjustments and pray.
Selection bias is fine-ish if you’re trying to do something like test a correlation. Does eating bananas make people smarter because something something potassium? Get a bunch of Psych 101 undergrads, test their IQs, and ask them how many bananas they eat per day (obviously there are many other problems with this study, like establishing causation — let’s ignore those for now). If you find that people who eat more bananas have higher IQ, then fine, that’s a finding. If you’re right about the mechanism (something something potassium), then probably it should generalize to groups other than Psych 101 undergrads. It might not! But it’s okay to publish a paper saying “Study Finds Eating Bananas Raises IQ” with a little asterisk at the bottom saying “like every study ever done, we only tested this in a specific population rather than everyone in the world, and for all we know maybe it isn’t true in other populations, whatever.” If there’s some reason why Psych 101 undergrads are a particularly bad population to test this in, and any other population is better, then you should use a different population. Otherwise, choose your poison.
December 9, 2022
QotD: Computer models of “the future”
Second, the video ignores the fact that human behavior changes in response to circumstance, sometimes in radically unpredictable ways. I might predict that we will hit peak oil (or be extremely wealthy) if I extrapolate various trends. However, as oil becomes scarce, people discover new ways to obtain it or do without it. As people become wealthier, they become less interested in the pursuit of wealth and therefore become poorer. Both of those scenarios, however, assume that humanity will adopt a moral and optimistic stance. If humans become decadent and pessimistic, they might just start wars and end up feeding off the scraps.
So, interestingly, what the future looks like might be as much a function of the music we listen to, the books we read, and the movies we watch when we are young as of the resources that are available.
Note that the solution they propose to our problems is internationalization. The problem with internationalizing everything is that people have no one to appeal to. We are governed by a number of international laws, but when was the last time you voted in an international election? How do you effect change when international policies are not working out correctly? Who do you appeal to?
The importance of nationalism is that there are well-known and generally-accepted procedures for addressing grievances with the ruling class. These international clubs are generally impervious to the appeals (and common sense) of ordinary people and tend to promote virtue-signaling among the wealthy class over actual virtue or solutions to problems.
Jonathan Bartlett, quoted in “1973 Computer Program: The World Will End In 2040”, Mind Matters News, 2019-05-31.
October 28, 2022
QotD: “Cliodynamics”, aka “megahistory”
Attentive readers will have already sensed that I have issues with these kinds of arguments; indeed, for all of my occasional frustrations with political science literature (much of which is perfectly fine, but it seems a frequent and honestly overall positive dynamic that historians tend to be highly critical of political scientists) I consider “cliodynamics” to generally take the worst parts of data-driven political science methodologies to apotheosis while discarding most of the virtues of data-driven poli-sci work.
As would any good historian, I have a host of nitpicks, but my objection to the idea of “cliodynamics” has to do with the way that it proposes to tear away the context of the historical data. I think it is worth noting at the outset the claim actually being made here because there is often a bit of motte-and-bailey that goes on, where these sorts of megahistories make extremely confident and very expansive claims and then when challenged is to retreat back to much more restricted claims but Turchin in particular is explicit in Secular Cycles (2009) that “a basic premise of our study is that historical societies can be studied with the same methods physicists and biologists used to study natural systems” in the pursuit of discovering “general laws” of history.
Fundamentally, the approach is set on the premise that the solution to the fact that the details of society are both so complex (imagine charting out the daily schedules of every person one earth for even a single day) and typically so poorly attested is to aggregate all of that data to generate general rules which could cover any population over a long enough period. To my mind, there are two major problems here: predictability and evidence. Let’s start with predictability.
And that’s where we get to Isaac Asimov, because this is essentially also how the “psychohistory” of the Foundation series functions (or, for the Star Trek fans, how the predictions in the DS9 episode “Statistical Probabilities“, itself an homage to the Foundation series, function). The explicit analogy offered is that of the laws that govern gasses: while no particular molecule of a gas can modeled with precision, the entire body of gas can be modeled accurately. Statistical probability over a sufficiently large sample means that the individual behaviors of the individual gas molecules combine in the aggregate to form a predictable whole; the randomness of each molecule “comes out in the wash” when combined with the randomness of the rest.2
I should note that Turchin rejects comparisons to Asimov’s psychohistory (but also embraced the comparison back in 2013), but they are broadly embraced by his boosters. Moreover, Turchin’s claim at the end of that blog post that “prediction is overrated” is honestly a bit bizarre given how quick he is when talking with journalists to use his models to make predictions; Turchin has expressed some frustration with the tone of Graeme Wood’s piece on him, but “We are almost guaranteed” is a direct quote that hasn’t yet been removed and I can speak from experience: The Atlantic‘s fact-checking on such things is very vigorous. So I am going to assume those words escaped the barrier of his teeth and also I am going to suggest here that “We are almost guaranteed” is, in fact, a prediction and a fairly confident one at that.
The problem with applying something like the ideal gas law – or something like the population dynamics of beetles – to human societies is fundamentally interchangeability. Statistical models like these have to treat individual components (beetles, molecules) the way economists treat commodities: part of a larger group where the group has qualities, but the individuals merely function to increase the group size by 1. Raw metals are a classic example of a commodity used this way: add one ton of copper to five hundred tons of copper and you have 501 tons of copper; all of the copper is functionally interchangeable. But of course any economist worth their pencil-lead will be quick to remind you that not all goods are commodities. One unit of “car” is not the same as the next. We can go further, one unit of “Honda Civic” is not the same as the next. Heck, one unit of 2012 Silver Honda Civic LX with 83,513 miles driven on it is not the same as the next even if they are located in the same town and owned by the same person; they may well have wildly different maintenance and accident histories, for instance, which will impact performance and reliability.
Humans have this Honda Civic problem (that is, they are not commodities) but massively more so. Now of course these theories do not formally posit that all, say, human elites are the same, merely that the differences between humans of a given grouping (social status, ethnic group, what have you) “come out in the wash” at large scales with long time horizons. Except of course they don’t and it isn’t even terribly hard to think of good examples.
1 Yes, I am aware that Gat was consulted for Better Angels and blurbed the book. This doesn’t change my opinion of the two books. my issue is fundamentally evidentiary: War is built on concrete, while Better Angels is built on sand when it comes to the data they propose to use. As we’ll see, that’s a frequent issue.
2 Of course the predictions in the Foundation series are not quite flawlessly perfect. They fail in two cases I can think of: the emergence of a singular exceptional individual with psychic powers (the Mule) and situations in which the subjects of the predictions become aware of them. That said Seldon is able to predict things with preposterous accuracy, such that he is able to set up a series of obstacles for a society he knows they will overcome. The main problem is that these challenges frequently involve conflict or competition with other humans; Seldon is at leisure to assume such conflicts are predictable, which is to say they lack Clausewitzian (drink!) friction. But all conflicts have friction; competition between peers is always unpredictable.
Bret Devereaux, “Fireside Friday: October 15, 2021”, A Collection of Unmitigated Pedantry, 2021-10-15.
October 27, 2022
QotD: Life expectancy before the modern age
Severian, “Overturning Locke: Life”, Rotten Chestnuts, 2019-09-11.
September 22, 2022
California’s Central Valley of despair
At Astral Codex Ten, Scott Alexander wonders why California’s Central Valley is in such terrible shape — far worse than you’d expect even if the rest of California is looking a bit curdled:

Here’s a topographic map of California (source):
You might notice it has a big valley in the center. This is called “The Central Valley”. Sometimes it also gets called the San Joaquin Valley in the south, or the the Sacramento Valley in the north.
The Central Valley is mostly farms — a little piece of the Midwest in the middle of California. If the Midwest is flyover country, the Central Valley is drive-through country, with most Californians experiencing it only on their way between LA and SF.
Most, myself included, drive through as fast as possible. With a few provisional exceptions — Sacramento, Davis, some areas further north — the Central Valley is terrible. It’s not just the temperatures, which can reach 110°F (43°C) in the summer. Or the air pollution, which by all accounts is at crisis level. Or the smell, which I assume is fertilizer or cattle-related. It’s the cities and people and the whole situation. A short drive through is enough to notice poverty, decay, and homeless camps worse even than the rest of California.
But I didn’t realize how bad it was until reading this piece on the San Joaquin River. It claims that if the Central Valley were its own state, it would be the poorest in America, even worse than Mississippi.
This was kind of shocking. I always think of Mississippi as bad because of a history of racial violence, racial segregation, and getting burned down during the Civil War. But the Central Valley has none of those things, plus it has extremely fertile farmland, plus it’s in one of the richest states of the country and should at least get good subsidies and infrastructure. How did it get so bad?
First of all, is this claim true?
I can’t find official per capita income statistics for the Central Valley, separate from the rest of California, but you can find all the individual counties here. When you look at the ones in the Central Valley, you get a median per capita income of $21,729 (this is binned by counties, which might confuse things, but by good luck there are as many people in counties above the median-income county as below it, so probably not by very much). This is indeed lower than Mississippi’s per capita income of $25,444, although if you look by household or family income, the Central Valley does better again.
Of large Central Valley cities, Sacramento has a median income of $33,565 (but it’s the state capital, which inflates it with politicians and lobbyists), Fresno of $25,738, and Bakersfield of $30,144. Compare to Mississippi, where the state capital of Jackson has $23,714, and numbers 2 and 3 cities Gulfport and Southhaven have $25,074 and $34,237. Overall Missisippi comes out worse here, and none of these seem horrible compared to eg Phoenix with $31,821. Given these numbers (from Google), urban salaries in the Central Valley don’t seem so bad. But when instead I look directly at this list of 280 US metropolitan areas by per capita income, numbers are much lower. Bakersfield at $15,760 is 260th/280, Fresno is 267th, and only Sacramento does okay at 22nd. Mississippi cities come in at 146, 202, and 251. Maybe the difference is because Google’s data is city proper and the list is metro area?
Still, it seems fair to say that the Central Valley is at least somewhat in the same league as Mississippi, even though exactly who outscores whom is inconsistent.
September 4, 2022
Who was reading during Plague Year Two, and what format did they prefer?
In the latest edition of the SHuSH newsletter, Kenneth Whyte summarizes some of the findings of the most recent Booknet survey:
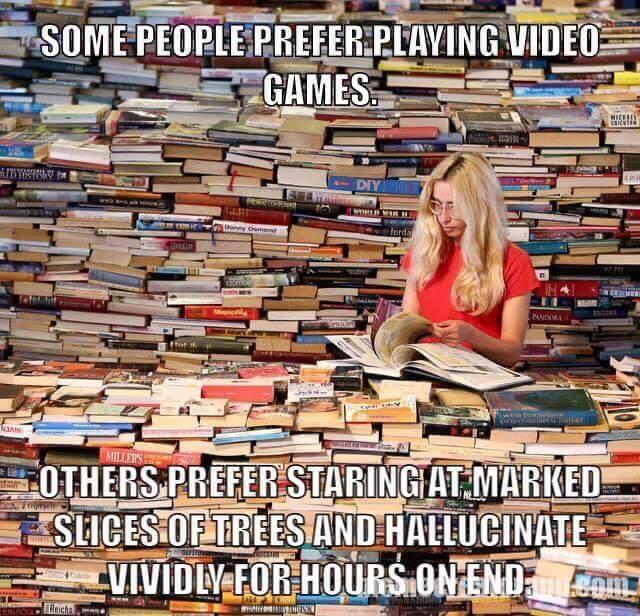
H/T to Marc Adkins who shared this meme at the perfect moment for me to steal it, file off the serial number and repost it here.
A few months ago, BookNet Canada, which does a lot of valuable research into the book market, released the 2021 edition of its annual survey of Canadian leisure and reading habits. It’s always an interesting study. I was slow getting to it this year because there’s been so much else going on. Here are the ten most interesting findings.
- Canadians have had plenty of time on their hands: 81 per cent report having enough or more than enough leisure. Pre-COVID, about 25 per cent of respondents said they had more-than-enough; during COVID, that jumped to about 35 per cent. The pandemic wasn’t all bad.
- Canadians read books more than they listen to radio or play video games but less than they shop or cook; 42 per cent of us (led by 58 per cent of the 65-plus crowd) read books daily; 35 per cent of the 18-29 age group read daily and 57 per cent of that cohort read at least once a week. Young people are no more likely to read books less than once a month than any other under-65 segment, which bodes well for the future of the industry.
- The statement “books are for enjoyment, entertainment, or leisure” received a ‘yes’ from 62 per cent of respondents, and a ‘sometimes’ from 34 per cent; the statement “books are for learning or education” received a ‘yes’ from 41 per cent of respondents and a ‘sometimes’ from 50 per cent.
- The top reasons for selecting a book to read are the author (40 per cent), the book’s description (30 per cent), recommendations (25 per cent), the main character or the series (20 per cent), its bestselling status (14 per cent), and reference needs (13 per cent). “Recommendations and the impact of bestseller lists have trended down from 2019 to 2021.”
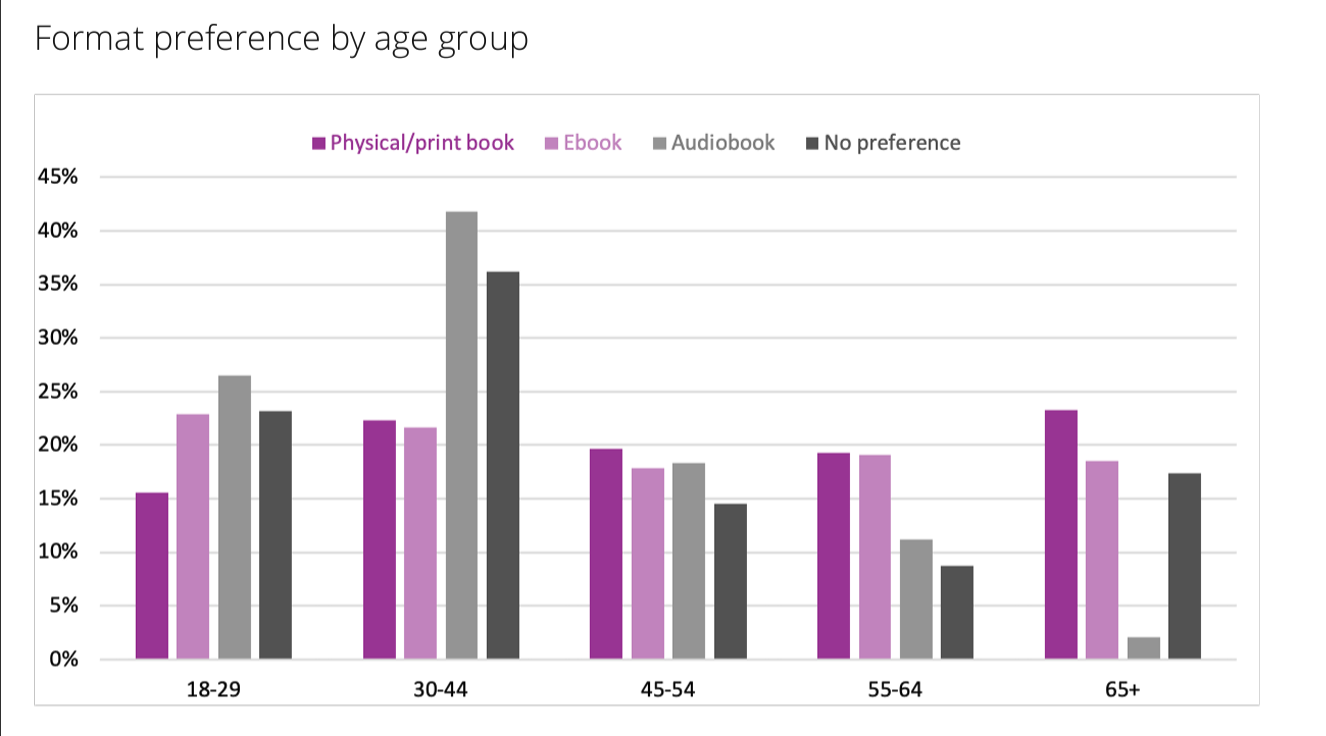
- The love affair with print continues with 68 per cent of readers citing hard copies as their preferred format. Ebooks came in at 16 per cent and audiobooks at 10 per cent Interestingly, readers had a marked preference for paperbacks over hardcovers. Format preferences differ from age group to age group, with some evidence that the kids might not be keen on physical books:
I was interested in that apparent rejection of physical books by the 18-29 cohort so I looked back at the last two years of the survey […] The results are quite different, suggesting a methodological shortcoming (the survey sample is 1,282 adults so the margin of error will be large when you eliminate those who don’t read a given format, those without format preferences, and break the remainder down into five age groups).