One of the interesting findings about mobile phones is that they grow the economy. In a country without a general landline network – ie, all the poor ones – 10% of the population gaining a mobile increases GDP by 0.5%. No, not the growth rate goes up from 2% to 2.01%. But an additional 0.5% of GDP each year. Which is, by the standards of these things, pretty big.
We also know why too. Being able to contact people means that markets complete, contracts and transactions are possible. It’s no longer necessary to near randomly meet someone physically in order to be able to organise a transaction. Thus more transactions happen – the value added in voluntary transactions being that GDP which is increasing.
Tim Worstall, “Mobile Phones Cut The Murder Rate – For the Same Reason They Grow The Economy”, Continental Telegraph, 2019-05-30.
January 1, 2023
QotD: The amazing economic impact of mobile phones in the developing world
October 15, 2020
QotD: What the GDP is failing to show (even though it’s there)
Our problem is that we know technological revolutions produce growth. Yet economic growth is limp at best, meagre perhaps a better description. So, there’s something wrong here. Either our basic understandings about how growth occurs are wrong and we [are] loathe to agree to that. Not because too much is bound up in that understanding but because too much of it makes sense. The other explanation is that we’re counting wrong.
[…]
We know that we’ve not quite got new products and their falling prices in our estimates of inflation quite correctly. They tend to enter the inflation indices after their first major price falls, meaning that inflation is always overstated. Given that the number we really look at is real growth – nominal growth minus inflation – this means we are consistently underestimating real growth.
[…]
The more we dig into this the more convinced I am that our only real economic problem at present is counting. Everything makes sense if we are counting output and inflation incorrectly, under-estimating the first, over- the second. If we are doing that – and we know that we are, only not quite to what extent – then all other economic numbers make sense. We’re in the midst of a large technological change, we’ve full employment by any reasonable measure, wages and productivity should be rising strongly. If we’re mismeasuring as above then those two are rising strongly, we’re just not capturing it. Oh, and if that’s also true then inequality is lower than currently estimated too.
The thing is, the more we study the details of these questions the more it becomes clear that we are mismeasuring, and mismeasuring enough that all of the claimed problems, the low growth, low productivity rises, low wage growth, simply aren’t there in the first place. And if they ain’t then nothing needs to be done about them, does it? Except, perhaps, count properly.
Tim Worstall, “Where’s All The Economic Growth? Goldman Sachs Blames Apple’s iPhone”, Continental Telegraph, 2018-07-03.
August 16, 2020
This is a “hockey stick” graph you can believe
Brian Micklethwait says this graph, unlike the more famous (debunked) “hockey stick”, shows one of the most important moments in human history:
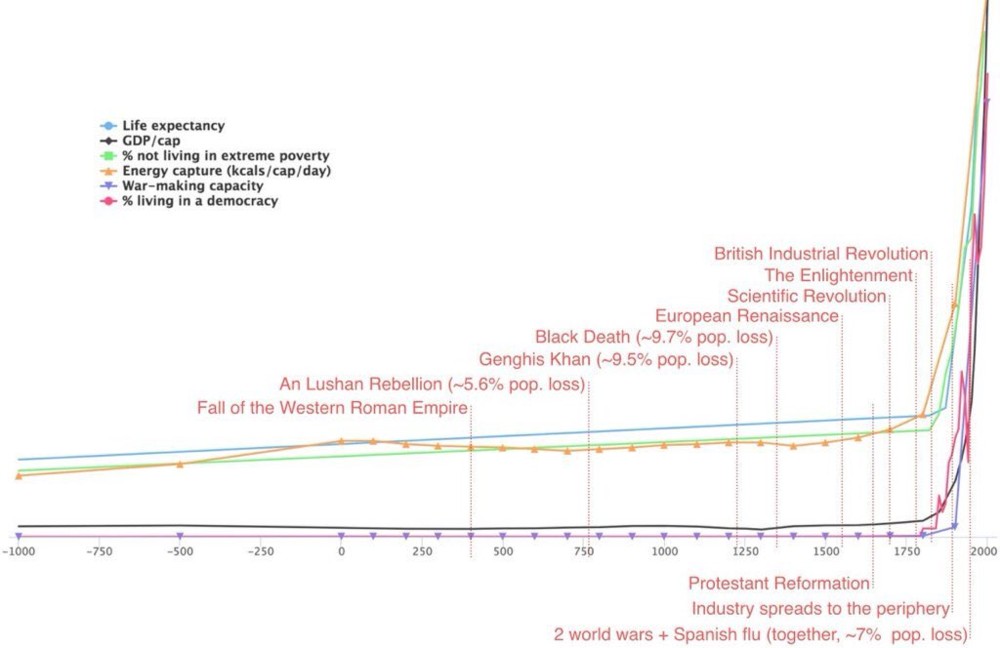
If that graph, or another like it, is not entirely familiar to you, then it damn well should be. It pinpoints the moment when our own species started seriously looking after its own creature comforts. This was, you might say, the moment when most of us stopped being treated no better than farm animals, and we began turning ourselves into each others’ pets.
Patrick Crozier and I will be speaking about this amazing moment in the history of the human animal in our next recorded conversation. That will, if the conversation happens as we hope and the recording works as we hope, find its way to here.
I’m not usually one for podcasts, in the same way that I’m not an audiobook user: I find I’m unable to do other things while listening to the spoken word, and it’s always far faster to read a text than to have it read to you. In this particular case, I might try to make an exception, and give up hope of doing anything else productive while I listen.
April 15, 2020
When the Fed Does Too Much
Marginal Revolution University
Published 22 Aug 2017In the 2000s, the Fed kept interest rates low to stimulate aggregate demand. But the cheap credit also helped fuel the housing market bubbles. We’ll look at the case of the Great Recession as an example of where the Fed did too much in one area, and perhaps not enough in others.

October 17, 2019
England in 1550 was a remarkably unpromising location for the later industrial revolution
Anton Howes, in his investigations on the Industrial Revolution looks back in time to see where or even if England deviated from the rest of Europe in ways that made the revolution possible, thinks he’s located the crucial time:
If a peaceful extraterrestrial visited the world in 1550, I often wonder where it would see as being the most likely site of the Industrial Revolution – an acceleration in the pace of innovation, resulting in sustained and continuous economic growth. So many theories about why it happened in Britain seem to have a sense of inevitability about them, but our extraterrestrial visitor would have found very few signs that it would soon occur there. There were many better candidates, on a multitude of metrics.
[…]
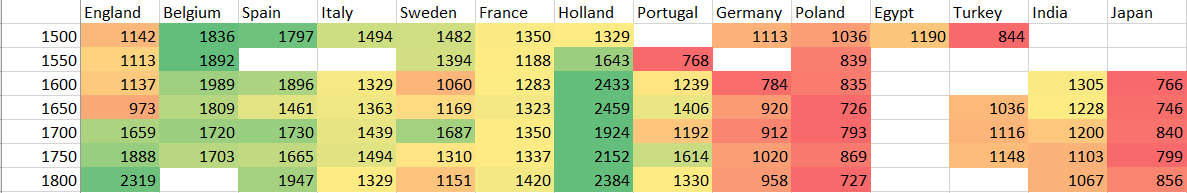
But England in 1550 was by global standards quite poor. Historical GDP per capita measures are notoriously difficult to obtain, even for some countries in the twentieth century let alone the sixteenth. The historical GDP per capita of England – by far the most studied region – is still hotly debated among economic historians. Nonetheless, according to the most recent collection of estimates – the Maddison project’s database of 2018 – in 1550 our extraterrestrial visitor would have been much more interested in Belgium. England at that stage lagged behind almost all of the areas for which we have estimates: Holland, Spain, Italy, Sweden, and France. In 1600, it was behind Portugal and India. Here are the figures in 2011 dollars; the colours are by row:
Such estimates should of course be taken with a hefty boulder of salt. (Note, also, that these particular figures, called “CGDPpc”, are something of an innovation by the team compiling the Maddison Project Database – they use multiple benchmarks to improve how we compare countries’ relative incomes in any particular year, which comes at the cost of not being able to compare their growth rates, for which there are separate figures. In other words, you should read the figures by row, not by column.) But it is worth noting that the more recent research on historical GDP per capita, finally filling in some details for regions other than England and Holland, often results in those other countries seeming richer in the sixteenth and seventeenth centuries. The more we know, the more the traces of an early English divergence seem to disappear.
Even without access to such statistics, however, our visitor would have noticed that in the mid-1550s England suffered severe food shortages. Indeed, the threat of famine would be present right up until the beginning of the eighteenth century: there was a major famine in the north of England in 1649, and even a famine in the 1690s that killed between five and fifteen percent of Scotland’s population. Britain would one day become perhaps the first famine-free region, but that did not occur until much later, when innovation had already begun to accelerate. It may even have been its result.
And England in 1550 was not just poor; it was also weak. If our visitor thought, as some historians do, that conquest and exploitation were essential for future growth, then it was Spain that had the major overseas empire, followed by Portugal. England in 1550 had no colonies in the New World, and its attempts to found them all failed until the seventeenth century, by which stage the Dutch and French had also begun to extend their own empires too. It was not until the eighteenth century that Britain began to exceed them.
March 16, 2019
MMT – Magic Money Theory
Antony Davies and James R. Harrigan explain just why so many progressives are so excited about MMT:
Modern Monetary Theory, or MMT, is all the rage in the halls of Congress lately.
To hear the Progressive left tell it, MMT is not unlike a goose that keeps laying golden eggs. All we have to do is pick up all the free money. This is music to politicians’ ears, but Fed Chairman Jerome Powell is singing a decidedly different tune. Said Powell recently on MMT, “The idea that deficits don’t matter for countries that can borrow in their own currency … is just wrong.”
MMT advocates see this as outdated thinking. We can, they claim, spend as much as we want on whatever we want, unencumbered by trivialities like how much we have. But MMT is a bait-and-switch wrapped in a sleight-of-hand. It focuses on debt and dollars rather than resources and products. Debt and dollars are merely tools we use to transfer ownership of resources and products. It’s the resources and products that matter. Shuffling debt and dollars merely changes the ownership of resources and products. It doesn’t create more.
[…]
So here’s the sleight of hand. MMT advocates say that we won’t experience inflation because the U.S. dollar is a reserve currency — foreigners hold lots of U.S. dollars. First, increasing the money supply, other things constant, does create inflation. But when a reserve currency inflates, the pain gets spread around the world instead of being concentrated within one country. In short, MMT advocates believe our government should print money and let foreigners bear some of the inflation pain. Second, there’s no law that says that the U.S. dollar must be a reserve currency. The British Pound was one, but as its value declined, foreigners stopped holding it. Foreigners will stop holding U.S. dollars too as their value declines.
And here’s the bait-and-switch. MMTers say that if inflation does become a problem, the government can simply raise tax rates to soak up excess dollars. In short, the government would print money with one hand, buying whatever it wants and causing inflation. It would then tax with the other, thereby removing dollars from the economy and counteracting the inflation. In the end, all that’s happened is that the government has replaced goods and services that people want with goods and services politicians want.
After a bout of MMT, we might have the same GDP and zero inflation, but what constitutes that GDP would have changed dramatically. Instead of having more cars and houses, we might have more tanks and border walls.
March 9, 2019
Old posts (from the old blog) about Chinese official economic statistics
This post at Continental Telegraph a few days back reminded me I wanted to get around to gathering some of my older posts about the reasons to take the official GDP numbers from the Chinese government with more than just a pinch of salt. Here’s my very first rant on the topic from 10 August, 2004 (original expired URL – http://bolditalic.com/quotulatiousness_archive/000323.html):
On my way in to work this morning, I heard a stock advisor doing his best to make reasonable assumptions about what the average listener needed to know about the economy. This guy has been pretty level-headed in the past, but this morning’s talk just got my head ready to explode.
The topic of discussion was the Chinese economy and how the Chinese central bank was having to take greater efforts to rein in economic expansion. He talked about how many different sectors of the North American economy were, to greater or lesser degree, depending more and more on Chinese growth to increase their own investments and output. The idea that the Chinese economy was "overheating" was bandied about. He closed by indicating that a slight drop in the official growth rate from 9.8% to 9.6% showed that the Chinese central bank was seeing some results from their intervention in the economy.
There are so many things wrong here that I’m almost at a loss where to start. While there is no doubt that China is a fast-growing economy, the most common mistake among both investors and pundits is to assume that China is really just like South Carolina or Ireland … a formerly depressed area now achieving good results from modernization. The problem is that China is not just the next Atlanta or Slovenia. China is still, more or less, a command economy with a capitalist face. One of the biggest players in the Chinese economy is the army, and not just in the sense of being a big purchaser of capital goods (like the United States Army, for example).
The Chinese army owns or controls huge sectors of the economy, and runs them in the same way it would run a division or an army corps. The very term "command economy" would seem to have been minted to describe this situation. The numbers reported by these "companies" bear about the same resemblance to reality as those posted by Enron or Worldcom. With so much of their economy not subject to profit and loss, every figure from China must be viewed as nothing more than a guess (at best) or active disinformation.
Probably the only figures that can be depended upon for any remote accuracy would be the imports from other countries — as reported by the exporting firms, not by their importing counterparts — and the exports to other countries. All internal numbers are political, not economic. When a factory manager can be fired, he has his own financial future at stake. When he can be sentenced to 20 years of internal exile, he has his life at stake. There are few rewards for honesty in that sort of environment: and many inducements to go along with what you are told to do.
Under those circumstances, any growth figures are going to be aggregated from all sectors, most of which are under strong pressure to report the right numbers, not necessarily corresponding with any real measurement of economic activity. So, if the economic office wants to see a drop in the economy, that’s what they’ll get.
Basing your own personal financial plans on numbers like this would quickly have you living in a cardboard box under a highway overpass. Companies in the soi-disant free world have shareholders or owners to answer to. Companies in China exist in a totally different environment.
I returned to the same topic on October 25, 2004, triggered by yet another talking head on the radio under the heading “More Economic Voodoo — or is that Feng Shui?” (original URL – http://www.bolditalic.com/quotulatiousness_archive/000580.html):
Again this morning, I was listening to my local jazz radio station on the way in to work. As usual, they had a broker from CIBC Wood Gundy giving portfolio advice at about 9:20 a.m. Today’s talk was about investing in China, and how the markets have been reacting to the recent small drop in the official GDP growth figures released by the Chinese central bank.
This time, the emphasis was on the idea that in spite of the breathtaking growth figures, Chinese firms still are not particularly profitable and that therefore there are better ways of investing your money to benefit from all that growth. Unlike the last time I addressed this issue, this time I thought that the advisor was actually making pretty good sense. The incredible transformation of China from a pure command-driven economy to a mixed economy will certainly provide lots of opportunities for people to get rich; it will also provide even more opportunities to lose big money.
Much of the problem is that even now, the Chinese economy is not particularly free: the official and unofficial controls on the economy provide far too many opportunities for rent-seeking officialdom to play favourites and cripple antagonists (and for once, "cripple" is not just a bit of hyperbole). Any numbers provided by the Chinese authorities cannot be depended upon, and should probably only be viewed as an indication of what the Chinese government wants the outside world to believe.
Even in a relatively free economy like Canada, the underground economy can be huge, with plenty of economic activity happening out of reach of the taxman. In China, where everybody was raised in an environment where providing the "wrong" answer to your leader could get you imprisoned (or executed) as an economic criminal, the numbers upon which the bankers and financial officials depend can only be described as extremely unreliable.
Update 26 October: The Last Amazon asks a highly pertinent and pointed question:
In the past week, the Globe and Mail has been featuring the economic engine that China has become. Its economy is thriving so much so that Chinese government owned companies like China Minmetals Corp (which had revenues in 2003 of USD$11.7 billion) is currently negotiating to buy outright 100% of the stock of the Canadian mining corporation, Noranda Inc. The total stock is estimated at approximately CDN$6.7 billion.
If the Chinese government can afford to buy Noranda Inc. why hasn’t anyone asked when China will reimburse the overburdened Canadian taxpayers of this fair land for the Cdn$65.4 million that has been given to China as foreign aid?
I managed to stay away from the topic until April 13, 2007, when I posted “The Chinese Economy”, which largely quoted from my first two posts (old URL – http://bolditalic.netfirms.com/quotulatiousness_archive/003649.html):
Everyone must have heard many different variations on how incredible the Chinese economy is: spectacular growth, innovations galore, etc., etc. And there’s much truth to it — China has been industrializing at a mind-croggling pace. At least, the visual evidence says so. The economic data coming out of China is, to be kind, not as dependable as similar data from most other countries. […]
Three years on, I must retract a tiny bit there … Enron’s and Worldcom’s figures, while deliberately misleading, were refutable (and the culprits taken to court). […]
Samizdata links to a brief Tyler Cowen post which includes this quote:
…of the 3,220 Chinese citizens with a personal wealth of 100 million yuan ($13 million) or more, 2,932 are children of high-level cadres. Of the key positions in the five industrial sectors – finance, foreign trade, land development, large-scale engineering and securities – 85% to 90% are held by children of high-level cadres.
That’s even higher than I expected. But it’s an excellent example of what I originally wrote about back in 2004: the economy isn’t free, and the beneficiaries are disproportionally those who are politically well-connected. Caveat investor.
And that was when I discovered that my “full” backup of files from the old site is actually missing nearly a year of posts from May 2008 to May 2009 (when I moved to the current site). I vaguely recall that Jon (my former virtual landlord) was having problems with limited storage on that site — I was just a freeloading guest — so perhaps one of the things we lost was the auto-archiving after we reached a certain capacity.
Thanks to the Wayback Machine, I found a couple of other entries but they were often just rehashes of the first two posts interspersed with quotations from articles I felt were being too Pollyanna-ish about the Chinese economic numbers, like this one from May 2, 2008:
Those untrustworthy Chinese economic numbers
Regular readers will know that I’ve been a long-term skeptic about the economic figures reported by the Chinese government (for example, here and here back in 2004). As a result, this post at the Economist is not very surprising:
As China’s importance in the global economy increases, investors are paying more attention to its economic numbers. Yet the country’s official statistics are notoriously ropy. Some commentators accuse China’s government of overstating GDP growth for political reasons, others complain that the official inflation rate is fraudulently low. So which data can you trust?
One reason to be suspicious of GDP figures is that China is always one of the first countries to report them, usually only two weeks after the end of each quarter. Most developed economies take between four and six weeks to produce them.
However, The Economist still feels that the Chinese economy is larger than reported. My sense of distrust in the figures argues for it being neither as big nor as robust as the reported figures indicate. They’re professional economic reporters … I’m a guy typing a blog entry. I wonder what the long-term odds are for either of us to be closer to the truth?
It’s tough to disagree with this, though:
The prize for the dodgiest figures goes to the labour market. The quarterly urban unemployment rate is meaningless because it excludes workers laid off by state-owned firms as well as large numbers of migrant workers, who normally live in urban areas but are not registered. Wage figures are also lousy. There has recently been much concern about the faster pace of increase in average urban earnings. But this series does not cover private firms, which are where most jobs have been created in recent years.
Now that China is such an engine of global growth, it urgently needs to improve its economic data. Only a madman would drive a juggernaut at full speed with a faulty speedometer, a cracked rear-view mirror and a misty windscreen.
By this point, Jon was referring to my obsession with bogus Chinese economic statistics as my “hobby horse” … yet it wasn’t unknown for him to send me links to articles on that very topic. Here’s another post, courtesy of the Wayback Machine, from January 23, 2009:
China’s economic situation
There’s an article at The Economist today that shows a touching belief in the magic of the Chinese economy. The reported Gross Domestic Product has fallen to “only” 5.8%. The Economist‘s writer spends much of the article worrying about this gloomy report:
New figures show that China’s GDP growth fell to 6.8% in the year to the fourth quarter, down from 9% in the third quarter and half its 13% pace in 2007. Growth of 6.8% may still sound pretty robust, but it implies that growth was virtually zero on a seasonally adjusted basis in the fourth quarter.
Industrial production has slowed even more sharply, growing by only 5.7% in the 12 months to December, compared with an 18% pace in late 2007. Thousands of factories have closed and millions of migrant workers have already lost their jobs. But there could be worse to come. Chinese exports are likely to drop further in coming months as world demand shrinks. Qu Hongbin, an economist at HSBC, forecasts that exports in the first quarter could be 19% lower than a year ago. 2009 may well see the first full-year decline in exports in more than a quarter of a century.
Economists have become gloomier about China’s prospects, with many now predicting GDP growth of only 5-6% in 2009, the lowest for almost two decades.
I’ve blogged about the Chinese economy on a few occasions (most recently here), generally with the same concern: that the numbers reported cannot be relied upon. The same is true here. Interestingly, the Economist article I linked to back in May makes this point quite well, yet today’s article appears to treat the Chinese government’s numbers as solid.
China has changed substantially from twenty years ago, and in many ways for the better. Most ordinary Chinese today are more free — economically anyway — than they were a generation ago, and there is a lot more opportunity for individuals to set up businesses and to succeed without needing Party connections. All this is indisputable … yet vast swathes of the Chinese economy are a legacy of the worst command-and-control period. It’s not an exaggeration to say that we can expect to discover the “official numbers” have absolutely no relationship to reality, because the numbers are compiled from various sources including both free-r quasi-capitalist companies and tottering government-owned (and often People’s Liberation Army-owned) conglomerates which cannot be depended upon to report anything accurately.
An example from this article: “a fall in electricity output of 6% in the year to the fourth quarter, down from average annual growth of 15% over the previous five years.” That’s not just a reduction in the rate of growth, that’s a reported drop in output of 6%. Imagine what the state of a European or Japanese/Korean economy running at only 94% of electricity … it’d be something you’d only see at times of severe economic contraction, not as a sign of a slow-down in growth.
Finally, on May 22, 2009, a final post on the topic at the old blog:
Official Chinese statistics
If you’ve read the blog for a while, you’ll know that I’m pretty skeptical about how believable the official statistics coming from the Chinese government may be. The Economist is somewhat undecided on the matter … sometimes publishing articles that treat the official numbers as legitimate and other times, showing more doubt:
Part of the recent optimism in world markets rests on the belief that China’s fiscal-stimulus package is boosting its economy and that GDP growth could come close to the government’s target of 8% this year. Some economists, however, suspect that the figures overstate the economy’s true growth rate and that Beijing would report 8% regardless of the truth. Is China cheating?
Economists have long doubted the credibility of Chinese data and it is widely accepted that GDP growth was overstated during the previous two downturns. In 1998-99, during the Asian financial crisis, China’s GDP grew by an average of 7.7%, according to official figures. However, using alternative measures of activity, such as energy production, air travel and imports, Thomas Rawski of the University of Pittsburgh calculated that the growth rate was at best 2%. Other economists reckon that Mr Rawski was too pessimistic. Arthur Kroeber of Dragonomics, a research firm in Beijing, estimates GDP growth was around 5% in 1998-99, for example. The top chart, plotting the official growth rate against estimates by Dragonomics, clearly suggests that some massaging of the government statistics may have gone on. The biggest adjustment seems to have been made in 1989, the year of political protests in Tiananmen Square. Officially, GDP grew by over 4%; Dragonomics reckons it actually declined by 1.5%.
Of course, The Economist doesn’t want to lose sales in China, so the last paragraph of the article blithely re-assures readers that things are improving and that the official numbers are much harder to fudge now than they used to be. That may well be true (I rather hope it is), but in the same way that you can get much more impressive growth from a very small base, you can become much more honest with your numbers when you’re starting from pure fiction.
[…] Let’s just say that I’m still unconvinced.
After that, my hobby-horse rides can be found by searching for “china economy” (or just click this link) on the current blog, or you can just peruse the China category.
December 30, 2018
The Long-Run Aggregate Supply Curve
Marginal Revolution University
Published on 25 Apr 2017The long-run aggregate supply curve is actually pretty simple: it’s a vertical line showing an economy’s potential growth rates. Combining the long-run aggregate supply curve with the aggregate demand curve can help us understand business fluctuations.
For example, while the U.S. economy grows at about 3% per year on average, it does tend to fluctuate quite a bit. What causes these fluctuations? One cause is “real shocks” that affect the fundamental factors of production. Droughts, changes to the oil supply, hurricanes, wars, technological changes, etc. can all have big and potentially far-reaching consequences.
Next week, we’ll dig into why wages are considered “sticky,” or slow to change.
November 23, 2018
The Aggregate Demand Curve
Marginal Revolution University
Published on 18 Apr 2017This wk: Put your quantity theory of money knowledge to use in understanding the aggregate demand curve.
Next wk: Use your knowledge of the AD curve to dig into the long-run aggregate supply curve.
The aggregate demand-aggregate supply model, or AD-AS model, can help us understand business fluctuations. In this video, we’ll focus on the aggregate demand curve.
The aggregate demand curve shows us all of the possible combinations of inflation and real growth that are consistent with a specified rate of spending growth. The dynamic quantity theory of money (M + v = P + Y), which we covered in a previous video, can help us understand this concept.
We’ll walk you through an example by plotting inflation on the y-axis and real growth on the x-axis — helping us draw an aggregate demand curve!
Next week, we’ll combine our new knowledge on the AD curve with the long-run aggregate supply curve. Stay tuned!
August 20, 2018
Causes of Inflation
Marginal Revolution University
Published on 24 Jan 2017In the last video, we learned the quantity theory of money and its corresponding identity equation: M x V = P x Y
For a quick refresher:
•M is the money supply.
•V is the velocity of money.
•P is the price level.
•And Y is the real GDP.
In this video, we’re rewriting the equation slightly to divide both sides by Y and explore the causes behind inflation. What we discover is that a change in P has three possible causes – changes in M, V, or Y.
You probably know that prices can change a lot, even over a short period of time.
Y, or real GDP, tends to change rather slowly. Even a seemingly small jump or fall in Y, such as 10% in a year, would signal astonishing economic growth or a great depression. Y probably isn’t our usual culprit for inflation.
V, or the velocity of money, also tends to be rather stable for an economy. The average dollar in the United States has a velocity of about 7. That may fall or rise slightly, but not enough to influence prices.
That leaves us with M. Changes in the money supply are the driving factor behind inflation. Put simply, when more money chases the same amount of goods and services, prices must rise.
Can we put this theory to the test? Let’s look at some real-world examples and see if the quantity theory of money holds up.
In Peru in 1990, hyperinflation came into full swing. If we track the growth rate of the money supply to the growth rate of prices, we can see that they align almost perfectly on a graph with both clocking in around 6,000% that year.
If we plot the growth rates of the money supply along with the growth rates of prices for a many countries over a long stretch of time, we can see the same relationship.
We’ll wrap-up the causes of inflation with three principles to keep in mind as we continue exploring this topic:
•Money is neutral in the long run: a doubling of the money supply will eventually mean a doubling of the price level.
•“Inflation is always and everywhere a monetary phenomena.” – Milton Friedman
•Central banks have significant control over a nation’s money supply and inflation rate.
August 12, 2018
Misunderstanding what the trade deficit represents
In a post from last week, Tim Worstall explains why Donald Trump is wrong about the economic impact of a trade deficit:
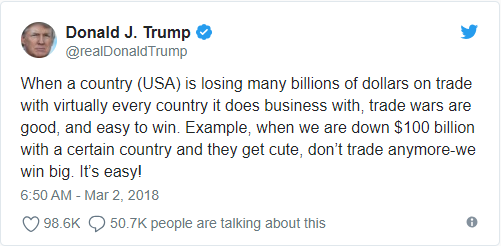
I should note here that I didn’t, because as a foreigner I can’t, support The Donald at the last election. But I didn’t support Hillary even more. So this is more about really, actually, insisting that Trump is wrong on trade issues rather than just the more general he’s wrong about everything common in the US press.
[…]
What Trump, DiMicco and Navarro are getting wrong is this, the GDP equation.
Y = C+I+G+(X-M)GDP is consumption plus investment plus government spending plus the trade balance – and minus it if there’s a trade deficit. So people look at this and think yep, if there’s a trade deficit than that makes Y, GDP, smaller!
But this is a mistake, an error. For, as the textbook immediately goes on to explain, what is it that we do with imports? Well, we either consume them, use them in investments or government buys them. So all imports are already in C and I and G. Meaning that if we don’t deduct them we’ll be double counting them. So, to avoid double counting we subtract them.
Trump and his advisers are simply wrong on this. The trade deficit doesn’t reduce the size of the economy. They’re getting it wrong simply because they’re not reading the second page of the explanation of the GDP equation.
June 30, 2018
Enriching the public in ways that do not show up in the GDP calculations
Tim Worstall looks at the calls to regulate the big tech firms and points out that we already get a very good deal on “free stuff” that isn’t reflected in standard economic statistics:
It won’t have escaped your attention that rather large numbers of people are calling for the regulation of the tech companies. The Amazon, Google, Facebook (Apple and Microsoft often added, just because they’re large) nexus have lots of power over markets and thus therefore – well, therefore something. My own prejudice here is that certain people just cannot look at centres of power and or money without insisting that they, the complainers, should be the ones exercising that power and determining the disposition of that money. Thus much of the drive for “democratic” regulation of the economy more generally, the self proclaimed democrats being the ones who would end up with the power. The advantage of this analysis being that it does describe reality, the same people do end up making the same arguments about different companies over time. Mere prominence brings the demand for control.
The economist on this subject is Jean Tirole. His Nobel was for exploring this very subject, tech companies and the two sided market. Google, for example, sells the search engine to us and us to the advertisers. The tech here is different, obviously, but the underlying economics is the same as that of the free newspaper.
Tirole’s a new book out and there are a number of interesting points to be had from it:
Yes, on the whole consumers tend to get a good deal, because we use wonderful services — like Google’s search engine, Gmail, YouTube, and Waze — for free. To be certain, we are not paid for the valuable data we provide to the platforms, as for example Eric Posner and Glen Weyl remind us in their recent book Radical Markets. But on the whole, our living standards have substantially improved thanks to the digital revolution.
From which we can extract a few points. We’re richer, we really are. Substantially richer and yet in a manner that normal economic statistics entirely fail to capture. As Hal Varian has pointed out, GDP doesn’t deal well with free. Near all of those benefits of the digital revolution are coming to us for free and so aren’t recorded in that GDP. So, we’re richer yet the numbers say we’re not. In that is much of the explanation of slow economic growth these days, even of slow real wage growth. We’re just not counting what is happening to our living standards.
But we can and should go further than that. If the above is true then we’re very much less unequal than we’re recording. Stuff that’s free is, obviously enough, distributed rather more evenly among the population than extant monetary incomes. You, me and Bill Gates all have access to exactly the same amount of Facebook at the same price. We’re entirely equal in that sense. Bill’s actually poorer concerning search engines, stuck for emotional reasons with Bing as he is while we get to use Google or DuckDuckGo. Our standard measures of inequality are wrong both because of the undermeasurement of new wealth and also the extremely equitable pattern of the distribution of that new wealth.
May 2, 2018
Uses and misuses of the Baltic Dry Index
At the Continental Telegraph, Tim Worstall explains why, for example, Zero Hedge‘s witterings about the changes in the Baltic Dry Index are not actually predictive of boom or bust in the global economy:
As background, the volume of such shipping – dry is referring to dry bulk cargoes, wheat, grains, cement, that is, not container stuff and not oils – is an important indicator of global growth. Trade tends to, tends to note, increase faster than growth itself. If the volume of trade falls off a cliff then we would indeed think that there’s going to be a kablooie in our global GDP figures.
The Baltic Dry is an index of the prices of shipping these cargoes. It’s thus the interaction of the supply of shipping as against the demand for it. That’s rather more than subtly different to the volume of world trade.
The basic background here is that there are reasonably long lead times to get more shipping afloat. And once it is afloat then it tends to stick around for a decade or two. Building the boat is a sunk cost (sorry) so you keep trying to use it as long as income from doing so is above marginal costs, of maintenance and fuel (and maintenance will be skipped in some circumstances) and bugger the mortgage. The supply of shipping is near entirely inelastic on an annual basis, near entirely elastic on a two decade basis.
Demand for shipping is much more elastic in that shorter term. As is usual when we’ve an inelastic supply meeting an elastic demand in a marketplace we get wild price swings. They being what causes that longer term elasticity – as with, say, oil from conventional reservoirs.
The Baltic Dry can drop because more ships are being launched, it can rise because more are scrapped. Not because – note the can here – the volume of trade has changed at all.
What has actually been happening in shipping in general is that the ship owners all looked at how trade was growing before 2008. So, they thought, aha! 5% volume growth! (Numbers here are made up but indicative of the major points) Let’s order more spanking new ships! Which then start arriving in 2010, 2011. Flooding the market with new supply. And shipping volume didn’t grow at 5%. It grew at 2% instead. (Again, these numbers are made up, reflecting memory and thus not accurate, but the relationships between them are about right) So, prices plunge.
But it’s those prices which plunge, not the volume of world trade.
April 19, 2018
The mis-measurement of the digital economy
In the Continental Telegraph, Tim Worstall explains why our current statistical model does not adequately reflect the online world’s contribution to our economy:
To give my favourite current example. WhatsApp is used by some billion people around the world for some to all of their telecoms needs. It turns up in economic statistics as a reduction in productivity.
That’s mad.
In more detail, WhatsApp is free to use and carries no advertising. That means there’s no sale associated with it. We measure consumption at market prices – a price of $0 means no consumption. Consumption is one of the three ways we measure GDP – each of the three should be the same as the other two but isn’t because lying about taxes.
The other two calculations are all incomes, or all production. Things that are sold at no price do not add to production given that we measure it at market prices.
Income, well, there’re 200 or so engineers at Facebook who work on it (I checked with Facebook itself). Say their salary is $250k a year each. Probably too low but we’ve got to use some number or other. $50 million then. That’s incomes added to GDP.
So, in our three methods of calculating GDP – they should all be the same but that doesn’t matter here – we’ve value of WhatsApp (more accurately, WhatsApp adds value of $x each year to the global economy) of $50 million. Or $0 or $0.
September 11, 2017
Harvey, Irma, and Frédéric – the “Broken Window Fallacy” returns
Jon Gabriel tries to set the record straight on what a natural disaster means for the economy (hint, ignore anyone who says the GDP will rise due to the recovery efforts):
Ever since Hurricane Harvey slammed into Texas two weeks ago, we’ve seen countless images of heroic rescues, flooded interstates and damaged buildings.
As awful as the human toll was, it was not as bad as many of us feared. But it will take months to repair the homes, businesses and infrastructure of Houston and the surrounding area. The same will be true in Florida after Hurricane Irma.
The economic impact could be felt for years, but many economists and financial experts think there’s a silver lining.
The Los Angeles Times crowed that Harvey’s destruction is expected to boost auto sales. CNBC reported that Harvey “could be a slight negative for U.S. growth in the third quarter, but economists say it may ultimately provide a tiny boost to the national economy because of the rebuilding in the Houston area.”
Even Goldman Sachs is looking at the bright side, noting that there could be an increase in economic activity, “reflecting a boost from rebuilding efforts and a catchup in economic activity displaced during the hurricane.”
Economically speaking, it’s great news that all this damage in Texas and Florida needs to be fixed, right? Not only does this mean big bucks for cleanup crews, but think of all the money that street sweepers, construction workers and Home Depots will rake in.
And what about all those windows broken by the high winds? This will be the Golden Age of Texas Glaziery!
Not so fast.
All of this is based on a misunderstanding of what the GDP actually measures. It’s a statistic that often gets mentioned in the newspapers and on TV, but it is almost always used in a way that misleads people about what is happening in the economy. GDP — Gross Domestic Product — is intended to show the approximate total of goods and services produced in a national economy. Thus, when the GDP goes up, it means that the current period being measured recorded more goods and services produced than in the previous period.
When a natural disaster like a hurricane, earthquake, flood, or tornado strikes a city, state or region, all the work required to fix the damage will artificially boost the recorded GDP for that year. But the affected area isn’t that much richer than it was before, despite the GDP going up, because the GDP does not measure the losses suffered during the natural disaster.
This is where Frédéric comes in. I’m referring to the French economist and author Frédéric Bastiat, who brilliantly illustrated the GDP misunderstanding in his essay “What Is Seen and What Is Not Seen“:
In the economic sphere an act, a habit, an institution, a law produces not only one effect, but a series of effects. Of these effects, the first alone is immediate; it appears simultaneously with its cause; it is seen. The other effects emerge only subsequently; they are not seen; we are fortunate if we foresee them.
There is only one difference between a bad economist and a good one: the bad economist confines himself to the visible effect; the good economist takes into account both the effect that can be seen and those effects that must be foreseen.
Yet this difference is tremendous; for it almost always happens that when the immediate consequence is favorable, the later consequences are disastrous, and vice versa. Whence it follows that the bad economist pursues a small present good that will be followed by a great evil to come, while the good economist pursues a great good to come, at the risk of a small present evil.
The GDP problem I identified at the start of this post is a general case of what Bastiat called the “Broken Window Fallacy”:
Have you ever been witness to the fury of that solid citizen, James Goodfellow, when his incorrigible son has happened to break a pane of glass? If you have been present at this spectacle, certainly you must also have observed that the onlookers, even if there are as many as thirty of them, seem with one accord to offer the unfortunate owner the selfsame consolation: “It’s an ill wind that blows nobody some good. Such accidents keep industry going. Everybody has to make a living. What would become of the glaziers if no one ever broke a window?”
Now, this formula of condolence contains a whole theory that it is a good idea for us to expose, flagrante delicto, in this very simple case, since it is exactly the same as that which, unfortunately, underlies most of our economic institutions.
Suppose that it will cost six francs to repair the damage. If you mean that the accident gives six francs’ worth of encouragement to the aforesaid industry, I agree. I do not contest it in any way; your reasoning is correct. The glazier will come, do his job, receive six francs, congratulate himself, and bless in his heart the careless child. That is what is seen.
But if, by way of deduction, you conclude, as happens only too often, that it is good to break windows, that it helps to circulate money, that it results in encouraging industry in general, I am obliged to cry out: That will never do! Your theory stops at what is seen. It does not take account of what is not seen.
It is not seen that, since our citizen has spent six francs for one thing, he will not be able to spend them for another. It is not seen that if he had not had a windowpane to replace, he would have replaced, for example, his worn-out shoes or added another book to his library. In brief, he would have put his six francs to some use or other for which he will not now have them.
Let us next consider industry in general. The window having been broken, the glass industry gets six francs’ worth of encouragement; that is what is seen.
If the window had not been broken, the shoe industry (or some other) would have received six francs’ worth of encouragement; that is what is not seen.
And if we were to take into consideration what is not seen, because it is a negative factor, as well as what is seen, because it is a positive factor, we should understand that there is no benefit to industry in general or to national employment as a whole, whether windows are broken or not broken.
Now let us consider James Goodfellow.
On the first hypothesis, that of the broken window, he spends six francs and has, neither more nor less than before, the enjoyment of one window.
On the second, that in which the accident did not happen, he would have spent six francs for new shoes and would have had the enjoyment of a pair of shoes as well as of a window.
Now, if James Goodfellow is part of society, we must conclude that society, considering its labors and its enjoyments, has lost the value of the broken window.
From which, by generalizing, we arrive at this unexpected conclusion: “Society loses the value of objects unnecessarily destroyed,” and at this aphorism, which will make the hair of the protectionists stand on end: “To break, to destroy, to dissipate is not to encourage national employment,” or more briefly: “Destruction is not profitable.”
Related: Shared by Thomas Forsyth on Facebook: