
A post by Jasmine Pui at History Today discusses a new online tool for economic analysis of the Roman Empire:
A recently launched online interactive research source, ORBIS, the Stanford Geospatial Network Model of the Roman World, has made it possible to analyse data about the Roman Empire in new ways that reveal the fragility of Roman communication and freight systems. Conventional maps are often unable to capture the environmental constraints that govern the flows of people, goods and information. Museum and ancient sites usually include titbits of information about the wide-ranging origins of artefacts, hinting at the relative cost of goods and labour in the Roman era, but factors such as sailing times and inland routes for freight cannot be precisely revealed through archaeological finds, Roman coins, taxation records or riot reports.
The first resource of its kind, ORBIS offers comprehensive graphic tools to portray the transport and communication infrastructure that underpinned the Roman Empire’s existence. By typing in a starting point, destination, an imagined weight of goods to transport and the time of year, the site shows whether such a movement would have been feasible and at what cost. Studying movement during the course of the empire’s existence suggests it was far more difficult to hold an empire together than to expand one. There are few scenarios where marching and conquering is not easier and less costly than moving goods and slaves between regions. Cost, rather than distance, was the principal determinant of connectivity in the Roman world.
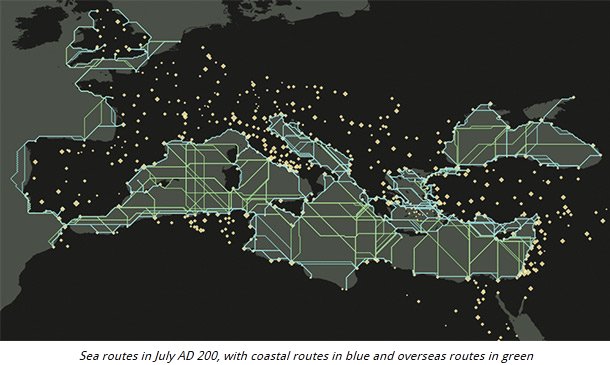
ORBIS is based on a simplified version of the giant network of cities, roads, rivers and sea lanes that framed movement across the Roman Empire. The Stanford team has relied on data such as historical tide and weather information, size and grade of road surfaces and an average walking distance of 30 kilometres per day. Hundreds of cities, ports and routes, vehicle speeds for ships, ox carts and horses, as well as the variable cost of transport have been logged. The data mainly focuses on the period around AD 200, when Septimius Severus expanded control of Africa and Roman power was at one of its peaks.


